En cherchant des graphiques cool sur le web , je suis tombé sur ce code MATLAB qui mixe les fonctions classiques meshgrid et patch :
[x y] = meshgrid( linspace(-3,3,50), linspace(-5,5,50) );
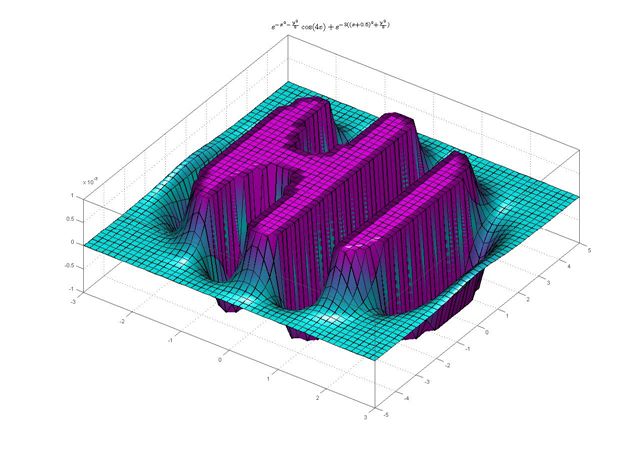
z = exp(-x.^2-0.5*y.^2).*cos(4*x) + exp(-3*((x+0.5).^2+0.5*y.^2));
idx = ( abs(z)>0.001 );
z(idx) = 0.001 * sign(z(idx));figure(‘renderer’,’opengl’)
patch(surf2patch(surf(x,y,z)), ‘FaceColor’,’interp’);
set(gca, ‘Box’,’on’, …
‘XColor’,[.3 .3 .3], ‘YColor’,[.3 .3 .3], ‘ZColor’,[.3 .3 .3], ‘FontSize’,8)
title(‘$e^{-x^2 – \frac{y^2}{2}}\cos(4x) + e^{-3((x+0.5)^2+\frac{y^2}{2})}$’, …
‘Interpreter’,’latex’, ‘FontSize’,12)view(35,65)
colormap( [flipud(cool);cool] )
camlight headlight, lighting phong
et voilĂ le rĂ©sultat ! MATLAB says hi ! beh ouais va falloir attendre un peu avant d’avoir la version française ![]()
j’adooooore , ce qui permet d’alimenter un peu plus notre catĂ©gorie blagues matlab et graphiques cools
bon voilĂ ce post c’est histoire de faire patienter la R2011a qui dĂ©cidĂ©ment est bien partie pour battre la date de sortie de la R14SP2 !