VoilĂ l’autre jour je faisait un histogramme dans un uipanel :
h = uipanel;
axes('parent',h)
x = -4:0.1:4;
y = randn(10000,1);
hist(y,x)
axes('parent',h)
x = -4:0.1:4;
y = randn(10000,1);
hist(y,x)
ce qui donne

maintenant en zoomant :
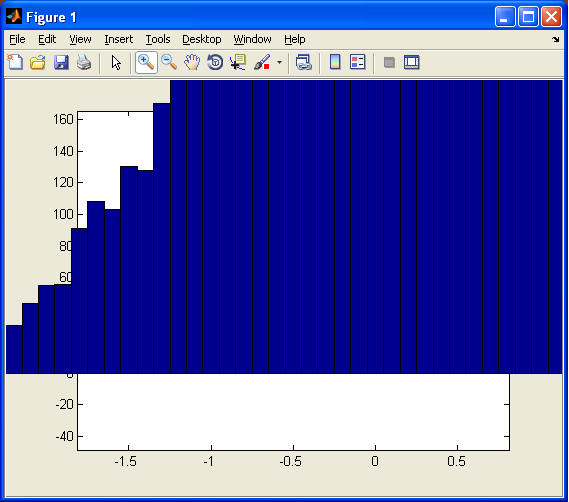
comme on peut le voir l’histogramme est sorti de l’axe.