In high mission-critical environments, ensuring high level of availability is a prerequisite and usually IT department addresses required SLAs (the famous 9’s) with high available architecture solutions. As stated by Wikipedia: availability measurement is subject to some degree of interpretation. Thus, IT department generally focus on uptime metric whereas for other departments availability is often related to application response time or tied to slowness / unresponsiveness complains. The latter is about application throughput and database locks may contribute to reduce it. This is something we are constantly monitoring in addition of the uptime in my company.
A couple of weeks ago, we began to experience suddenly some unexpected blocking issues that included some specific query patterns and SQL Server audit feature. This is all more important as this specific scenario began from one specific database and led to create a long hierarchy tree of blocked processes with blocked SQL Server audit operation first and then propagated to all databases on the SQL Server instance. A very bad scenario we definitely want to avoid … Here a sample of the blocking processes tree:
First, let’s set the context :
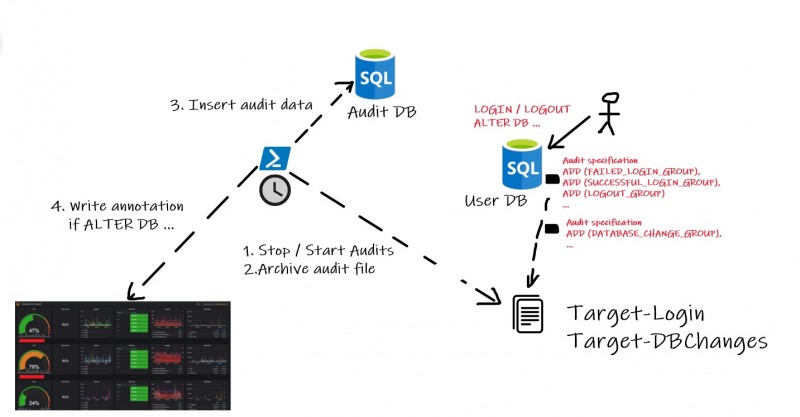
We are using SQL Server audit for different purposes since the SQL Server 2014 version and we actually running on SQL Server 2017 CU21 at the moment of this write-up. The obvious one is for security regulatory compliance with login events. We also rely on SQL Server audits to extend the observability of our monitoring system (based on Prometheus and Grafana). Configuration changes are audited with specific events and we link concerned events with annotations in our SQL Server Grafana dashboards. Thus, we are able to quickly correlate events with some behavior changes that may occur on the database side. The high-level of the audit infrastructure is as follows:
As shown in the picture above, a PowerShell script carries out stopping and restarting the audit target and then we use the archive audit file to import related data to a dedicated database.
Let’s precise we use this process without any issues since a couple of years and we were surprised to experience such behavior at this moment. Enough surprising for me to write a blog post ![]() … Digging further to the root cause, we pointed out to a specific pattern that seemed to be the root cause of our specific issue:
… Digging further to the root cause, we pointed out to a specific pattern that seemed to be the root cause of our specific issue:
1. Open transaction
2. Foreach row in a file execute an UPSERT statement
3. Commit transaction
This is a RBAR pattern and it may become slow according the number of lines it has to deal with. In addition, the logic is encapsulated within a single transaction leading to accumulate locks during all the transaction duration. Thinking about it, we didn’t face the specific locking issue with other queries so far because they are executed within short transactions by design.
This point is important because enabling SQL Server audits implies also extra metadata locks. We decided to mimic this behavior on a TEST environment in order to figure out what happened exactly.
Here the scripts we used for that purpose:
TSQL script:
USE [master]
GO
CREATE SERVER AUDIT [Audit-Target-Login]
TO FILE
( FILEPATH = N'/var/opt/mssql/log/'
,MAXSIZE = 0 MB
,MAX_ROLLOVER_FILES = 2147483647
,RESERVE_DISK_SPACE = OFF
)
WITH
( QUEUE_DELAY = 1000
,ON_FAILURE = CONTINUE
)
WHERE (
[server_principal_name] like '%\%'
AND NOT [server_principal_name] like '%\svc%'
AND NOT [server_principal_name] like 'NT SERVICE\%'
AND NOT [server_principal_name] like 'NT AUTHORITY\%'
AND NOT [server_principal_name] like '%XDCP%'
);
ALTER SERVER AUDIT [Audit-Target-Login] WITH (STATE = ON);
GO
CREATE SERVER AUDIT SPECIFICATION [Server-Audit-Target-Login]
FOR SERVER AUDIT [Audit-Target-Login]
ADD (FAILED_DATABASE_AUTHENTICATION_GROUP),
ADD (SUCCESSFUL_DATABASE_AUTHENTICATION_GROUP),
ADD (FAILED_LOGIN_GROUP),
ADD (SUCCESSFUL_LOGIN_GROUP),
ADD (LOGOUT_GROUP)
WITH (STATE = ON)
GO
USE [DBA]
GO
-- Tables to simulate the scenario
CREATE TABLE dbo.T (
id INT,
col1 VARCHAR(50)
);
CREATE TABLE dbo.T2 (
id INT,
col1 VARCHAR(50)
);
INSERT INTO dbo.T VALUES (1, REPLICATE('T',20));
INSERT INTO dbo.T2 VALUES (1, REPLICATE('T',20));
PowerShell scripts:
Session 1: Simulating SQL pattern
$server ='127.0.0.1'
$Database ='DBA'
$Connection =New-Object System.Data.SQLClient.SQLConnection
$Connection.ConnectionString = "Server=$server;Initial Catalog=$Database;Integrated Security=false;User ID=sa;Password=P@SSw0rd1;Application Name=TESTLOCK"
$Connection.Open()
$Command = New-Object System.Data.SQLClient.SQLCommand
$Command.Connection = $Connection
$Command.CommandTimeout = 500
$sql =
"
MERGE T AS T
USING T2 AS S ON T.id = S.id
WHEN MATCHED THEN UPDATE SET T.col1 = 'TT'
WHEN NOT MATCHED THEN INSERT (col1) VALUES ('TT');
WAITFOR DELAY '00:00:03'
"
#Begin Transaction
$command.Transaction = $connection.BeginTransaction()
# Simulate for each file => Execute merge statement
while(1 -eq 1){
$Command.CommandText =$sql
$Result =$Command.ExecuteNonQuery()
}
$command.Transaction.Commit()
$Connection.Close()
Session 2: Simulating stopping / starting SQL Server audit for archiving purpose
$Query = "
USE master;
ALTER SERVER AUDIT [Audit-Target-Login]
WITH ( STATE = OFF );
ALTER SERVER AUDIT [Audit-Target-Login]
WITH ( STATE = ON );
"
Invoke-DbaQuery `
-SqlInstance $server `
-Database $Database `
-SqlCredential $creds `
-Query $Query
First, we wanted to get a comprehensive picture of locks acquired during the execution of this specific SQL pattern by with an extended event session and lock_acquired event as follows:
ON SERVER
ADD EVENT sqlserver.lock_acquired
(
ACTION(sqlserver.client_app_name,
sqlserver.session_id,
sqlserver.transaction_id)
WHERE ([sqlserver].[client_app_name]=N'TESTLOCK'))
ADD TARGET package0.histogram
(
SET filtering_event_name=N'sqlserver.lock_acquired',
source=N'resource_type',source_type=(0)
)
WITH
(
MAX_MEMORY=4096 KB,
EVENT_RETENTION_MODE=ALLOW_SINGLE_EVENT_LOSS,
MAX_DISPATCH_LATENCY=30 SECONDS,
MAX_EVENT_SIZE=0 KB,
MEMORY_PARTITION_MODE=NONE,
TRACK_CAUSALITY=OFF,
STARTUP_STATE=OFF
)
GO
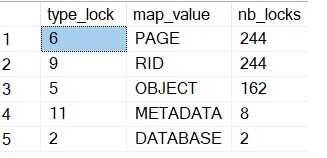
Here the output we got after running the first PowerShell session:
We confirm METADATA locks in addition to usual locks acquired to the concerned structures. We correlated this output with sp_WhoIsActive (and @get_locks = 1) after running the second PowerShell session. Let’s precise that you may likely have to run the 2nd query several times to reproduce the initial issue.
Here a picture of locks respectively acquired by session 1 and in waiting state by session 2:
…
We may identify clearly metadata locks acquired on the SQL Server audit itself (METDATA.AUDIT_ACTIONS with Sch-S) and the second query with ALTER SERVER AUDIT … WITH (STATE = OFF) statement that is waiting on the same resource (Sch-M). Unfortunately, my google Fu didn’t provide any relevant information on this topic excepted the documentation related to sys.dm_tran_locks DMV. My guess is writing events to audits requires a stable the underlying infrastructure and SQL Server needs to protect concerned components (with Sch-S) against concurrent modifications (Sch-M). Anyway, it is easy to figure out that subsequent queries could be blocked (with incompatible Sch-S on the audit resource) while the previous ones are running.
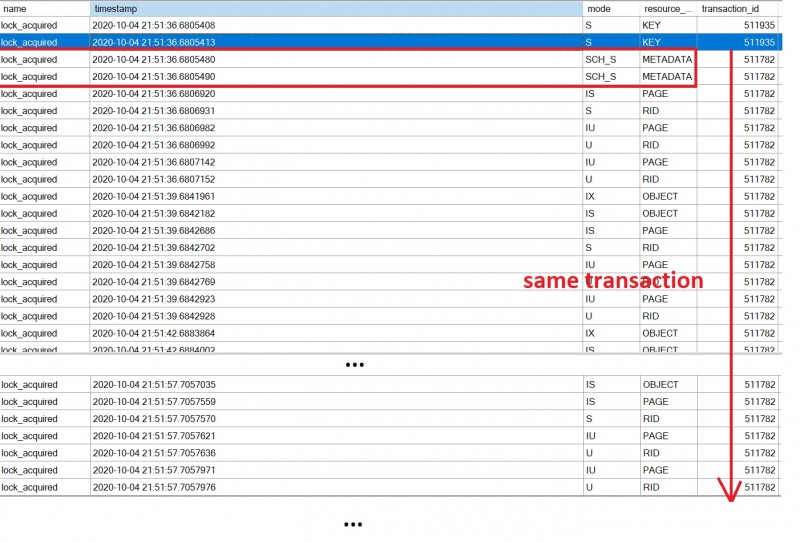
The query pattern exposed previously (unlike short transactions) is a good catalyst for such blocking scenario due to the accumulation and duration of locks within one single transaction. It may be confirmed by the XE’s output:
We managed to get a reproductible scenario with TSQL and PowerShell scripts. In addition, I also ran queries from other databases to confirm it may compromise responsiveness of the entire workload on the same instance (respectively DBA3 and DBA4 databases in my test).
How we fixed this issue?
Even it is only one part of the solution, I’m a strong believer this pattern remains a performance killer and using a set-bases approach may help to reduce drastically number and duration of locks and implicitly chances to make this blocking scenario happen again. Let’s precise it is not only about MERGE statement because I managed to reproduce the same issue with INSERT and UPDATE statements as well.
Then, this scenario really made us think about a long-term solution because we cannot guarantee this pattern will not be used by other teams in the future. Looking further at the PowerShell script which carries out steps of archiving the audit file and inserting data to the audit database, we finally added a QueryTimeout parameter value to 10s to the concerned Invoke-DbaQuery command as follows:
$query = "
USE [master];
IF EXISTS (SELECT 1
FROM sys.dm_server_audit_status
WHERE [name] = '$InstanceAuditPrefix-$AuditName')
BEGIN
ALTER SERVER AUDIT [$InstanceAuditPrefix-$AuditName]
WITH (STATE = OFF);
END
ALTER SERVER AUDIT [$InstanceAuditPrefix-$AuditName]
WITH (STATE = ON);
"
Invoke-DbaQuery `
-SqlInstance $Instance `
-SqlCredential $SqlCredential `
-Database master `
-Query $query `
-EnableException `
-QueryTimeout 5
...
Therefore, because we want to prioritize the business workload over the SQL Server audit operation, if such situation occurs again, stopping the SQL Server audit will timeout after reaching 5s which was relevant in our context. The next iteration of the PowerShell is able to restart at the last stage executed previously.
Hope this blog post helps.
See you!


Ping : 1reciprocity