
In a past, I went to different ways for improving update statistic maintenance in different shops according to their context, requirement and constraints as well as the SQL Server version used at this moment. All are important inputs for creating a good maintenance strategy which can be very simple with execution of sp_updatestats or specialized scripts to focus on some tables.
One of my latest experiences on this topic was probably one of the best although we go to circuitous way for dealing with long update statistic maintenance task on a large database. We used a mix of statistic analysis stuff and improvements provided by SQL Server 2014 SP1 CU6 and parallel update statistic capabilities. I wrote a blog post if you are interested in learning more on this experience.
I’m working now for a new company meaning a different context … At the moment of this write-up, we are running on SQL Server 2017 CU21 and database sizes are in different order of magnitude (more than 100GB compressed) compared to my previous experience. However, switching from default sampling method to FULLSCAN for some large tables drastically increased the update statistic task beyond to the allowed Windows time frame (00:00AM to 03:00AM) without any optimization.
Why to change the update statistic sampling method?
Let’s start from the beginning: why we need to change default statistic sample? In fact, this topic has been already covered in detail in the internet and to make the story short, good statistics are part of the recipe for efficient execution plans and queries. Default sampling size used by both auto update mechanism or UPDATE STATISTIC command without any specification come from a non-linear algorithm and may not produce good histogram with large tables. Indeed, the sampling size decreases as the table get bigger leading to a rough picture of values in the table which may affect cardinality estimation in execution plan … Exactly the side effects we experienced on with a couple of our queries and we wanted to minimize in the future. Therefore, we decided to improve cardinality estimation by switching to FULLSCAN method only for some big tables to produce better histogram. But this method comes also at the cost of a direct impact on consumed resources and execution time because the optimizer needs to read more data to build a better picture of data distribution and sometimes with an higher tempdb usage. Our first attempt on ACC environment increased the update statistic maintenance task from initially 5min with default sampling size to 3.5 hours with the FULLSCAN method and only for large tables … Obviously an unsatisfactory solution because we were out of the allowed Windows maintenance timeframe.
Context matters
But first let’s set the context a little bit more: The term “large” can be relative according to the environment. In my context, it means tables with more than 100M of rows and less than 100GB in size for the biggest one and 10M of rows and 10GB in size for lower ones. In fact, for partitioned tables total size includes the archive partition’s compression.
Another gusty detail: concerned databases are part of availability groups and maxdop for primary replica was setup to 1. There is a long story behind this value with some side effects encountered in the past when switching to maxdop > 1 and cost threshold for parallelism = 50. At certain times of the year, the workload increased a lot and we faced memory allocation issues for some parallel queries (parallel queries usually require more memory). This is something we need to investigate further but we switched back to maxdop=1 for now and I would say so far so good …
Because we don’t really have index structures heavily fragmented between two rebuild index operations, we’re not in favor of frequent rebuilding index operations. Even if such operation can be either done online or is resumable with SQL Server 2017 EE, it remains a very resource intensive operation including log block replication on the underlying Always On infrastructure. In addition, there is a strong commitment of minimizing resource overhead during the Windows maintenance because of concurrent business workload in the same timeframe.
Options available to speed-up update statistic task
Using MAXDOP / PERSIST_SAMPLE_PERCENT with UPDATE STATISTICS command
KB4041809 describes new support added for MAXDOP option for the CREATE STATISTICS and UPDATE STATISTICS statements in Microsoft SQL Server 2014, 2016 and 2017. This is especially helpful to override MAXDOP settings defined at the server or database-scope level. As a reminder, maxdop value is forced to 1 in our context on availability group primary replicas.
For partitioned tables we don’t go through this setting because update statistic is done at partition level (see next section). The concerned tables own 2 partitions, respectively CURRENT and ARCHIVE. We keep the former small in size and with a relative low number of rows (only last 2 weeks of data). Therefore, there is no real benefit of using MAXDOP to force update statistics to run with parallelism in this case.
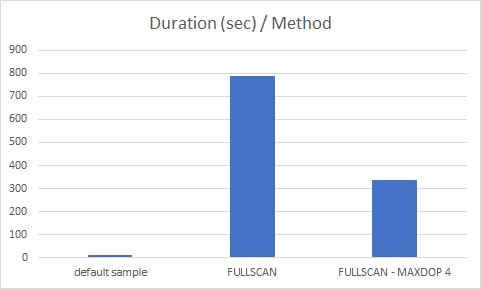
But non-partitioned large tables (>=10 GB) are good candidate. According to the following picture, we noticed an execution time reduction of 57% by increasing maxdop value to 4 for some large tables with these specifications:
– ~= 10GB
– ~ 11M rows
– 112 columns
– 71 statistics
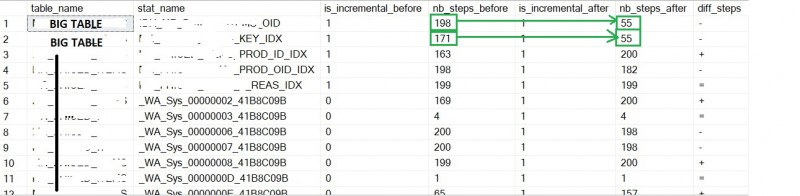
Another feature we went through is described in KB4039284 and available since with SQL Server 2016+. In our context, the maintenance of statistics relies on a custom stored procedure (not Ola maintenance scripts yet) and we have configured default sampling rate method for all statistics and we wanted to make exception only for targeted large tables. In the past, we had to use NO_RECOMPUTE option to exclude statistics for automatic updates. The new PERSIST_SAMPLE_PERCENT option indicates SQL Server to lock the sampling rate for future update operations and we are using it for non-partitioned large tables.
Incremental statistics
SQL Server 2017 provides interesting options to reduce maintenance overhead. Surprisingly some large tables were already partitioned but no incremental statistics were configured. Incremental statistics are especially useful for tables where only few partitions are changed at a time and are a great feature to improve efficiency of statistic maintenance because operations are done at the partition level since SQL Server 2014. Another blog post written a couple of years ago and here was a great opportunity to apply theorical concepts to a practical use case. Because we already implemented partition-level maintenance for indexes, it made sense to apply the same method for statistics to minimize overhead with FULLSCAN method and to benefit from statistic update threshold at the partition level. As said in the previous section, partitioned tables own 2 partitions CURRENT (last 2 weeks) and ARCHIVE and the goal was to only update statistics on the CURRENT partition on daily basis. However, let’s precise that although statistic objects are managed are the partition level, the SQL Server optimizer is not able to use them directly (no change since SQL Server 2014 to SQL Server 2019 as far as I know) and refers instead to the global statistic object.
Let’s demonstrate with the following example:
Let’s consider BIG TABLE with 2 partitions for CURRENT (last 2 weeks) and ARCHIVE values as shown below:
s.object_id,
s.name AS stat_name,
sp.rows,
sp.rows_sampled,
sp.node_id,
sp.left_boundary,
sp.right_boundary,
sp.partition_number
FROM sys.stats AS s
CROSS APPLY sys.dm_db_stats_properties_internal(s.object_id, s.stats_id) AS sp
WHERE s.object_id = OBJECT_ID('[dbo].[BIG TABLE]')
AND s.name = 'XXXX_OID'
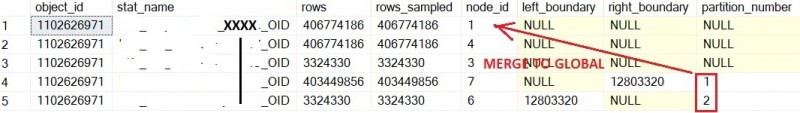
Statistic object is incremental, and we got an internal picture of per-partition statistics and the global one. You need to enable trace flag 2309 and to add node id reference to the DBCC SHOW_STATISTICS command as well. Let’s dig into the ARCHIVE partition to find a specific value within the histogram step:
GO
DBCC SHOW_STATISTICS('[dbo].[BIG TABLE]', 'XXX_OID', 7) WITH HISTOGRAM;
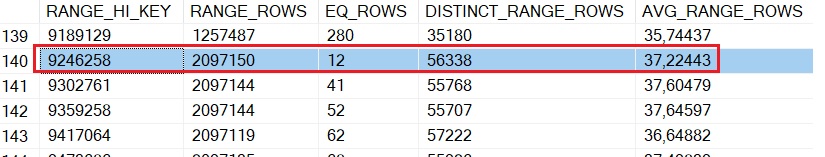
Then, I used the value 9246258 in the WHERE clause of the following query:
FROM dbo.[BIG TABLE]
WHERE XXXX_OID = 9246258
It gives an estimated cardinality of 37.689 rows as show below …
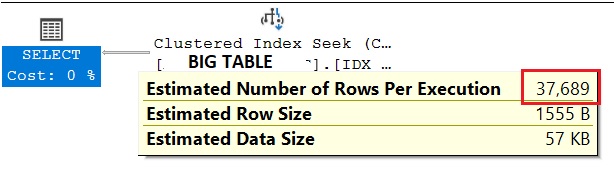
… Cardinality estimation is 37.689 while we should expect a value of 12 rows here referring to the statistic histogram above. Let’s now have a look at the global statistic (nodeid = 1):
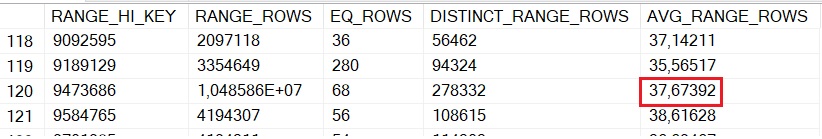
In fact, the query optimizer estimates rows by using AVG_RANGE_ROWS value between 9189129 and 9473685 in the global statistic. Well, it is likely not as perfect as we may expect. Incremental statistics do helps in reducing time taken to gather stats for sure, but it may not be enough to represent the entire data distribution in the table – We are still limited to 200 steps in the global statistic object. Pragmatically, I think we may mitigate this point by saying things could be worst somehow if we need either to use default sample algorithm or to decrease the sample size of your update statistic operation.
Let’s illustrate with the BIG TABLE. To keep things simple, I have voluntary chosen a (real) statistic where data is evenly distributed. Here some pictures of real data distribution:
The first one is a simple view of MIN, MAX boundaries as well as AVG of occurrences (let’s say duplicate records for a better understanding) by distinct value:
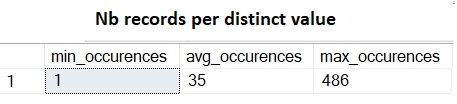
Referring to the picture above, we may notice there is no high variation of number of occurrences per distinct value represented by the leading XXX_OID column in the related index. In the picture below, another representation of data distribution where each histogram bucket includes the number of distinct values per number of occurrences.
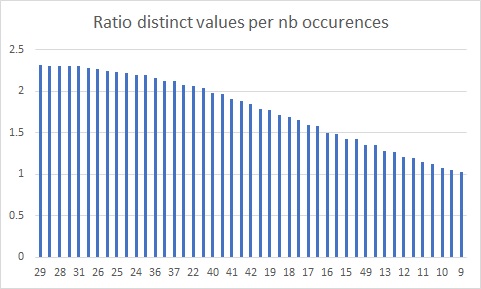
For example, we have roughly 2.3% of distinct values in the BIG TABLE with 29 duplicate records. The same applies for values 28, 31 and so on … In short, this histogram confirms a certain degree of homogeneity of data distribution and avg_occurences value is not so far from the truth.
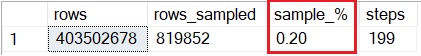
Let’s using default sample value for UPDATE STATISTICS. A very low sample of rows are taken into account leading to very approximative statistics as show below:
rows,
rows_sampled,
CAST(rows_sampled * 100. / rows AS DECIMAL(5,2)) AS [sample_%],
steps
FROM sys.dm_db_stats_properties(OBJECT_ID('[dbo].[BIG TABLE]), 1)
FROM sys.dm_db_stats_histogram(OBJECT_ID('[dbo].[BIG TABLE]), 1)
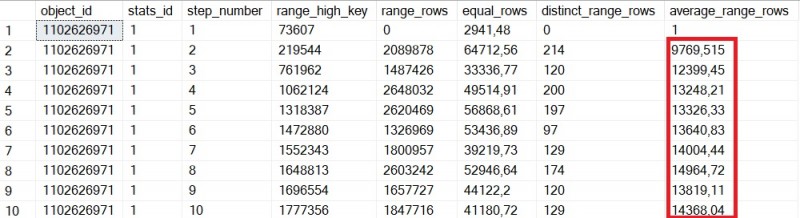
Focusing on average_range_rows colum values, we may notice estimation is not representative of real distribution in the BIG TABLE.
After running FULLSCAN method with UPDATE STATISTICS command, the story has changed, and estimation is now closer to the reality:
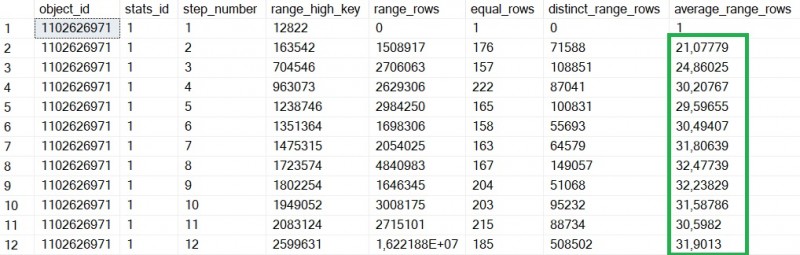
As a side note, one additional benefit of using FULLSCAN method is to get a representative statistic histogram in fewer steps. This is well-explained in the SQL Tiger team’s blog post and we noticed this specific behavior with some statistic histograms where frequency is low … mainly primary key and unique index related statistics.
How benefit was incremental statistic?
The picture below refers to one of our biggest partitioned large table with the following characteristics:
– ~ 410M rows
– ~ 63GB in size (including compressed partition size)
– 67 columns
– 30 statistics
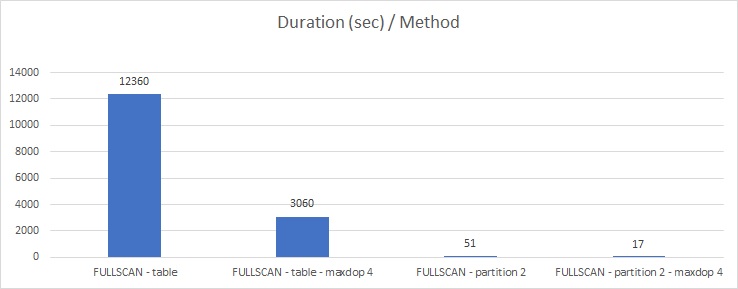
As noticed in the picture above, overriding maxdop setting at the database-scoped level resulted to an interesting drop in execution time when FULLSCAN method is used (from 03h30 to 17s in the best case)
Similarly, combining efforts done for both non-partitioned and partitioned larges tables resulted to reduced execution time of update statistic task from ~ 03h30 to 15min – 30min in production that is a better fit with our requirements.
Going through more sophisticated process to update statistic may seem more complicated but strongly required in some specific scenarios. Fortunately, SQL Server provides different features to help optimizing this process. I’m looking forward to seeing features that will be shipped with next versions of SQL Server.
Ping : 3ranging