
Stateful applications like databases need special considerations on K8s world. This is because data persistence is important and we need also something at the storage layer communicating with the container orchestrator to take advantage of its scheduling capabilities. For Stateful applications, StatefulSet may be only part of the solution because it primary focuses on the Pod availability and we have to rely on the application capabilities for data replication stuff. But StatefulSet doesn’t address that of the underlying storage at all. At the moment of this write-up, StatefulSet-based solutions for SQL Server such availability groups are not supported yet on production.
So, with Stateful applications we may consider other solutions like GlusterFS or NFS as distributed storage spanning all the nodes of the K8s cluster, but they often don’t meet the requirements of a database workload running in production with high throughput and IOPS requirement and data migration.
Products exist in the market and seem to address these specific requirements and I was very curious to get a better picture of their capabilities. During my investigation, I went through a very interesting one named Portworx for a potential customer’s project. The interesting part of Portworx consists of a container-native, orchestration-aware storage fabric including the storage operation and administration inside K8s. It aggregates underlying storage and exposes it as a software-defined, programmable block device.
From a high-level perspective, Portworx is using a custom scheduler – STORK (STorage Orchestration Runtime for Kubernetes) to assist K8s in placing a Pod in the same node where the associated PVC resides. It reduces drastically some complex stuff around annotations and labeling to perfmon some affinity rules.
In this blog post, I will focus only on the high-availability topic which is addressed by Portworx with volume’s content synchronization between K8s nodes and aggregated disks. Therefore Portworx requires to define the redundancy of the dataset between replicas through a replication factor value by the way.
I cannot expose my customer’s architecture here but let’s try top apply the concept to my lab environment.
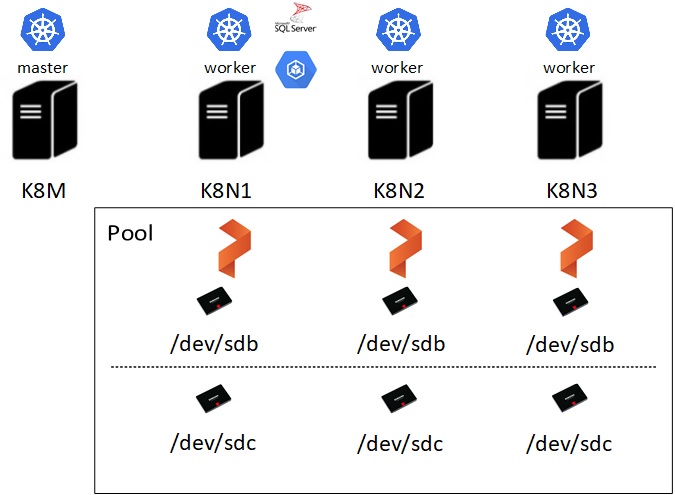
As shown above, my lab environment includes 4 k8s nodes with 3 nodes that will act as worker. Each worker node owns its local storage based on SSD disks (One for the SQL Server data files and the another one will handle Portworx metadata activity – Journal disk). After deploying Portworx on my K8s cluster here a big picture of my configuration:
portworx 3 3 3 3 3
portworx-api 3 3 3 3 3
Portworx is a DaemonSet-based installation. Each Portworx node will discover the availability storage to create a container-native block storage device with:
– /dev/sdb for my SQL Server data
– /dev/sdc for hosting my journal
portworx-555wf 1/1 Running 18 2d23h
portworx-api-2pv6s 1/1 Running 8 2d23h
portworx-api-s8zzr 1/1 Running 8 2d23h
portworx-api-vnqh2 1/1 Running 4 2d23h
portworx-pjxl8 1/1 Running 17 2d23h
portworx-wrcdf 1/1 Running 389 2d10h
px-lighthouse-55db75b59c-qd2nc 3/3 Running 0 35h
stork-5d568485bb-ghlt9 1/1 Running 0 35h
stork-5d568485bb-h2sqm 1/1 Running 13 2d23h
stork-5d568485bb-xxd4b 1/1 Running 1 2d4h
stork-scheduler-56574cdbb5-7td6v 1/1 Running 0 35h
stork-scheduler-56574cdbb5-skw5f 1/1 Running 4 2d4h
stork-scheduler-56574cdbb5-v5slj 1/1 Running 9 2d23h
The above picture shows different stork pods that may influence scheduling based on the location of volumes that a pod requires. In addition, the PX cluster (part of Portworx Enterprise Platform) includes all the Portworx pods and allows getting to monitor and performance insights of each related pod (SQL Server instance here).
Let’s have a look at the global configuration by using the pxctl command (first section):
$ kubectl exec $PX_POD -n kube-system -- /opt/pwx/bin/pxctl status
Status: PX is operational
License: Trial (expires in 28 days)
Node ID: 590d7afd-9d30-4624-8082-5f9cb18ecbfd
IP: 192.168.90.63
Local Storage Pool: 1 pool
POOL IO_PRIORITY RAID_LEVEL USABLE USED STATUS ZONE REGION
0 HIGH raid0 20 GiB 8.5 GiB Online default default
Local Storage Devices: 1 device
Device Path Media Type Size Last-Scan
0:1 /dev/sdb STORAGE_MEDIUM_MAGNETIC 20 GiB 08 Dec 19 21:59 UTC
total - 20 GiB
Cache Devices:
No cache devices
Journal Device:
1 /dev/sdc1 STORAGE_MEDIUM_MAGNETIC
…
Portworx has created a pool composed of my 3 replicas / Kubernetes nodes with a 20GB SSD each. I just used a default configuration without specifying any zone or region stuff for fault tolerance capabilities. This is not my focus at this moment. According to Portworx’s performance tuning documentation, I configured a journal device to improve I/O performance by offloading PX metadata writes to a separate storage.
Second section:
Nodes: 3 node(s) with storage (3 online)
IP ID SchedulerNodeName StorageNode Used Capacity Status StorageStatus Version Kernel OS
192.168.5.62 b0ac4fa3-29c2-40a8-9033-1d0558ec31fd k8n2.dbi-services.test Yes 3.1 GiB 20 GiB Online Up 2.3.0.0-103206b 3.10.0-1062.1.2.el7.x86_64 CentOS Linux 7 (Core)
192.168.40.61 9fc5bc45-5602-4926-ab38-c74f0a8a8b2c k8n1.dbi-services.test Yes 8.6 GiB 20 GiB Online Up 2.3.0.0-103206b 3.10.0-1062.1.2.el7.x86_64 CentOS Linux 7 (Core)
192.168.80.63 590d7afd-9d30-4624-8082-5f9cb18ecbfd k8n3.dbi-services.test Yes 8.5 GiB 20 GiB Online Up (This node) 2.3.0.0-103206b 3.10.0-1062.1.2.el7.x86_64 CentOS Linux 7 (Core)
Global Storage Pool
Total Used : 20 GiB
Total Capacity : 60 GiB
All my nodes are up for a total storage of 60 GiB. Let’s deploy a Portworx Storage Class with the following specification:
apiVersion: storage.k8s.io/v1
metadata:
name: portworx-sc
provisioner: kubernetes.io/portworx-volume
parameters:
repl: "3"
nodes: "b0ac4fa3-29c2-40a8-9033-1d0558ec31fd,9fc5bc45-5602-4926-ab38-c74f0a8a8b2c,590d7afd-9d30-4624-8082-5f9cb18ecbfd"
label: "name=mssqlvol"
fs: "xfs"
io_profile: "db"
priority_io: "high"
journal: "true"
allowVolumeExpansion: true
The important parameters are:
repl: « 3 » => Number of replicas (K8s nodes) where data will be replicated
nodes: « b0ac4fa3-29c2-40a8-9033-1d0558ec31fd,9fc5bc45-5602-4926-ab38-c74f0a8a8b2c,590d7afd-9d30-4624-8082-5f9cb18ecbfd » => Number of replicas used for data replication. Replicas are identified by their ID. Each write is synchronously replicated to a quorum set of nodes whereas read throughput is aggregated, where multiple nodes can service one read request in parallel streams.
fs: « xfs » => I used a Linux FS supported by SQL Server on Linux
io_profile: « db » => By default, Portworx is able to use some profiles according to the access pattern. Here I just forced it to use db profile that implements a write-back flush coalescing algorithm.
priority_io: « high » => I deliberately configured the IO priority value to high for my pool in order to favor maximum throughput and low latency transactional workloads. I used SSD storage accordingly.
journal: « true » => The volumes used by this storage class will use the journal dedicated device
allowVolumeExpansion: true => is an interesting parameter to allow online expansion of the concerned volume(s). As an aside, it is worth noting that volume expansion capabilities is pretty new (> v1.11+) on K8s word for the following in-tree volume plugins: AWS-EBS, GCE-PD, Azure Disk, Azure File, Glusterfs, Cinder, Portworx, and Ceph RBD
Then, let’s use Dynamic Provisioning with the following PVC specification:
apiVersion: v1
metadata:
name: pvcsc001
annotations:
volume.beta.kubernetes.io/storage-class: portworx-sc
spec:
accessModes:
- ReadWriteOnce
resources:
requests:
storage: 20Gi
Usual specification for a PVC … I just claimed 20Gi of storage based on my portworx storage class. After deploying both the Storage Class and PVC here the new picture of my configuration:
NAME PROVISIONER AGE
portworx-sc kubernetes.io/portworx-volume 3d14h
stork-snapshot-sc stork-snapshot 3d23h
$ kubectl get pvc
NAME STATUS VOLUME CAPACITY ACCESS MODES STORAGECLASS AGE
pvcsc001 Bound pvc-98d12db5-17ff-11ea-9d3a-00155dc4b604 20Gi RWO portworx-sc 3d13h
Note that there is also a special storage class implemention for snapshot capabilities, we will talk about this capability in next write-up. My PVC pvcs001 is ready to be used by my Stateful application. Now it’s time to deploy a Stateful application with my SQL Server pod and the specification below. Let’s say that Portworx volumes are usable for non-root execution containers when specifying fsGroup parameter (securityContext section). So,this is a good fit with the non-root execution capabilities shipped with SQL Server pod ![]() You will also notice there is no special labeling or affinity stuff between my pod and the PVC. I just defined the volume mount, the corresponding PVC and that’s it!
You will also notice there is no special labeling or affinity stuff between my pod and the PVC. I just defined the volume mount, the corresponding PVC and that’s it!
kind: Deployment
metadata:
name: mssql-deployment
spec:
replicas: 1
template:
metadata:
labels:
app: mssql
spec:
securityContext:
runAsUser: 10001
runAsGroup: 10001
fsGroup: 10001
terminationGracePeriodSeconds: 10
containers:
- name: mssql
image: mcr.microsoft.com/mssql/server:2019-GA-ubuntu-16.04
ports:
- containerPort: 1433
env:
- name: MSSQL_PID
value: "Developer"
- name: ACCEPT_EULA
value: "Y"
- name: MSSQL_SA_PASSWORD
valueFrom:
secretKeyRef:
name: sql-secrets
key: sapassword
volumeMounts:
- name: mssqldb
mountPath: /var/opt/mssql
resources:
limits:
cpu: "3500m"
requests:
cpu: "2000m"
volumes:
- name: mssqldb
persistentVolumeClaim:
claimName: pvcsc001
---
apiVersion: v1
kind: Service
metadata:
name: mssql-deployment
spec:
selector:
app: mssql
ports:
- protocol: TCP
port: 1470
targetPort: 1433
type: LoadBalancer
Let’s take a look at the deployment status:
NAME READY UP-TO-DATE AVAILABLE AGE
deployment.extensions/mssql-deployment 1/1 1 1 3d7h
NAME READY STATUS RESTARTS AGE
pod/mssql-deployment-67fdd4759-vtzmz 1/1 Running 0 45m
NAME TYPE CLUSTER-IP EXTERNAL-IP PORT(S) AGE
service/kubernetes ClusterIP 10.96.0.1 443/TCP 4d
service/mssql-deployment LoadBalancer 10.98.246.160 192.168.40.61 1470:32374/TCP 3d7h
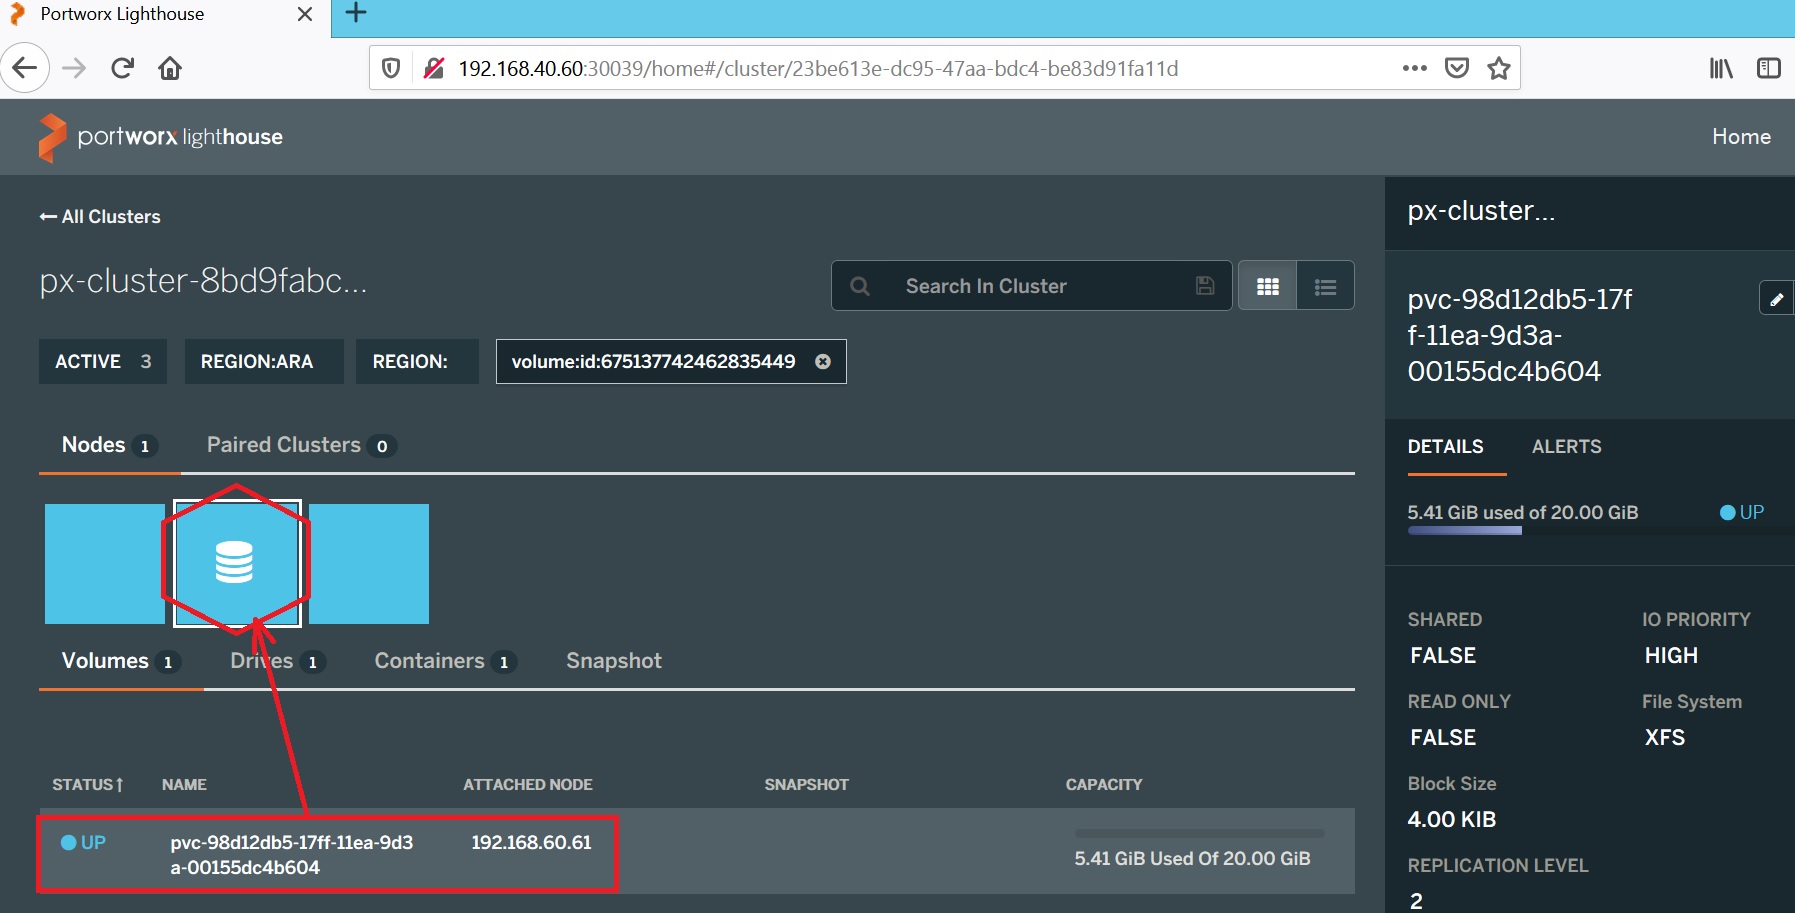
We’re now ready to test the HA capabilities of Portworx! Let’s see how STORK influences the scheduling to get my SQL Server pod on the same node where my PVC resides. The pxctl command provides different options to get information about the PX cluster and volumes as well as configuration and management capabilities. Here a picture of my volumes:
ID NAME SIZE HA SHARED ENCRYPTED IO_PRIORITY STATUS SNAP-ENABLED
675137742462835449 pvc-98d12db5-17ff-11ea-9d3a-00155dc4b604 20 GiB 2 no no HIGH up - attached on 192.168.40.61 no
$ kubectl get pod -o wide
NAME READY STATUS RESTARTS AGE IP NODE NOMINATED NODE READINESS GATES
mssql-deployment-67fdd4759-vtzmz 1/1 Running 0 48m 172.16.160.54 k8n1.dbi-services.test
My SQL Server pod and my Portworx storage sit together on the K8n1.dbi-services.test node. The PX web console is also available and provides the same kind of information as pxctl command does.
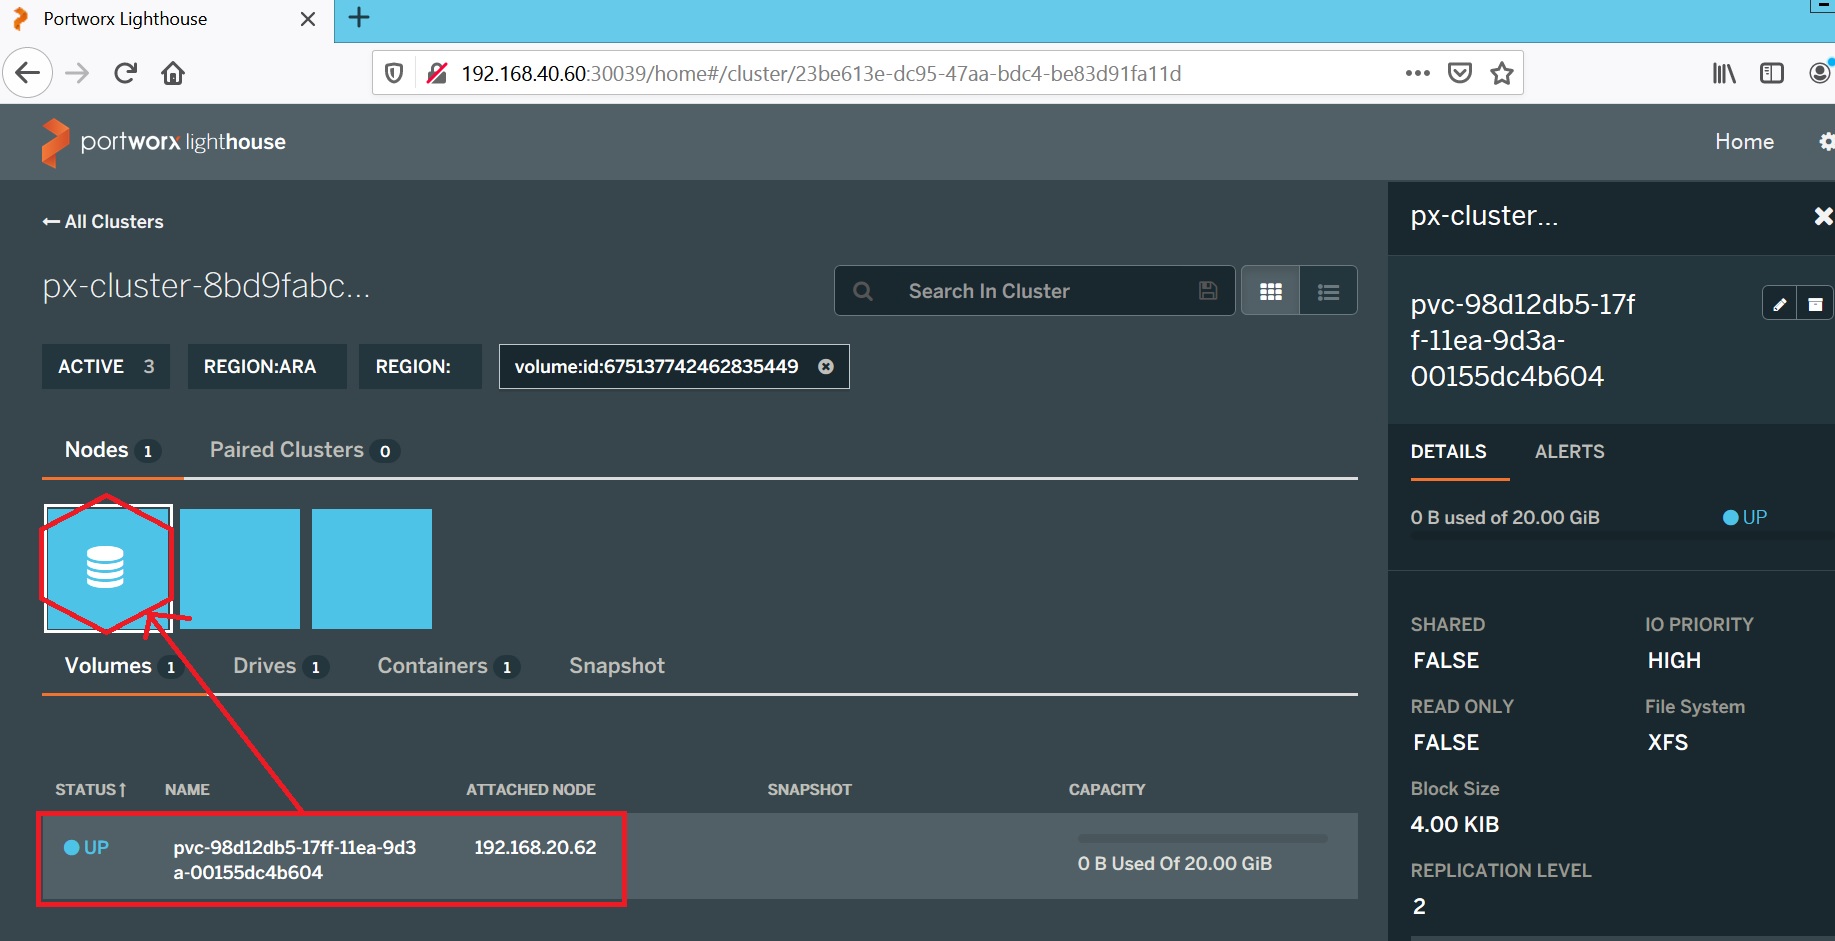
Let’s now simulate the K8n1.dbi-services.test node failure. In this scenario both my PVC and my SQL Server pod are going to move to the next available – K8n2 (192.168.20.62). This is where STORK comes into play to stick my pod with my PVC location.
…
NAME READY STATUS RESTARTS AGE IP NODE NOMINATED NODE READINESS GATES
mssql-deployment-67fdd4759-rbxcb 1/1 Running 0 31m 172.16.197.157 k8n2.dbi-services.test
Another important point, my SQL Server data survived to my pod restart and remained available through my SQL Server instance as expected !! It was a short introduction to Portworx capabilities here and I will continue to share about it in a near future!
See you !
David Barbarin
Ping : 2fertilizer