
A quick blog post to show how helpful an extended event and few other tools can be to help fixing orphan transactions in a real use case scenario. I often gave training with customers about SQL Server performance and tools, but I noticed how difficult it can be to explain the importance of a tool if you only explain theory without any illustration with a real customer case.
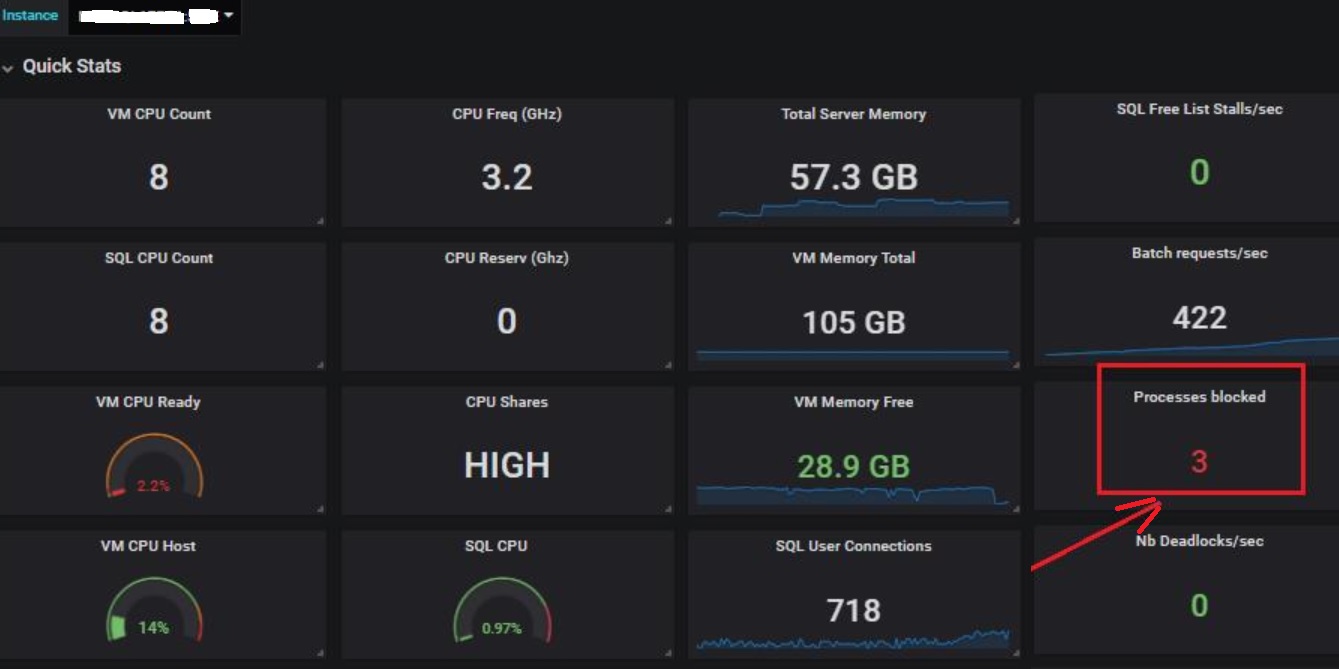
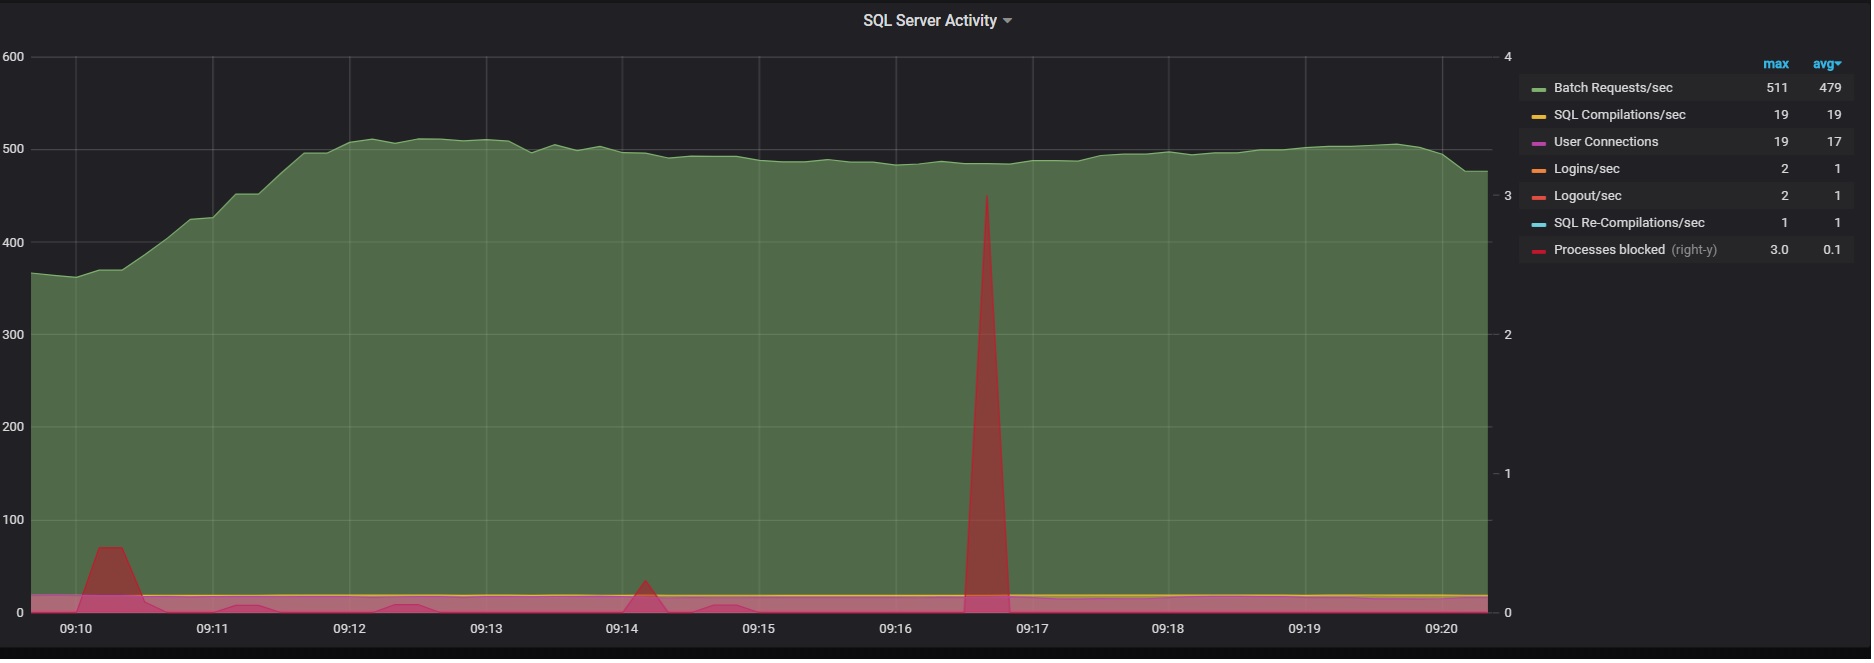
Well, let’s start my own story that began a couple of days ago with an SQL alert to indicate a blocking scenario issue. Looking at our SQL dashboard (below), we were able to confirm quickly we are running into an annoying issue and it would be getting worse over if we do nothing.
…
Let’s precise before continuing there are a plenty of tools to help digging into blocked processes scenarios and my intention is not to favor one specific tool over another one. So, in my case the first tool I used was the sp_WhoIsActive procedure from Adam Machanic. One great feature of it is to get a comprehensive picture of what is happening on your system at the moment you’re executing the procedure.
Here a sample of output I got. Let’s precise it doesn’t reflect exactly my context (which was a little more complex) but anyway my intention is not to focus on this specific part
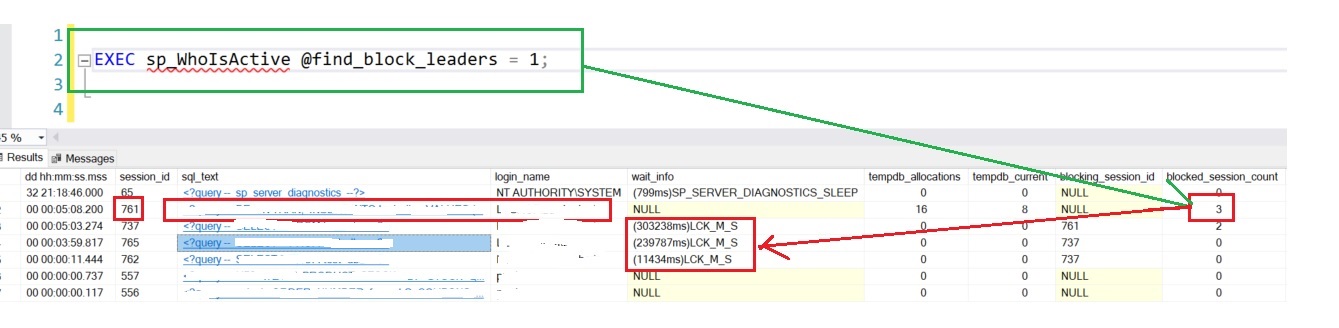
As you may see, I got quickly interesting information about the blocking leaders including session_id, the application name and the command executed as this moment. But the interesting part of this story was to get a request_id to NULL as well as a status value to SLEEPING. After some researches, having these values indicate likely that SQL Server has completed the command and the connection is waiting for the next command to come from the client. In addition, looking at the open_tran_count value (=1) confirmed the transaction was still opened. We started monitoring the transaction a couple of minutes to see if the application could manage to commit (or to rollback) the transaction but nothing happened. So, we had to kill the corresponding session to get back to a normal situation. A few minutes later, the situation came back with the same pattern and we applied the same temporary fix (KILL session).
The next step consisted in discussing with the DEV team to fix this annoying issue once and for all. We managed to reproduce this scenario in DEV environment, but it was not clear what happened exactly inside the application because we got not specific errors even when looking at the tracing infrastructure. To help the DEV team investigating the issue, we decided to create a special extended event session that both monitor all activity scoped to the concerned application and the transactions that remain open during the tracing timeframe. Events will be easily correlated relying on causality tracking capabilities of extended events.
So, the extended event session used two targets including the Event File and Histogram. Respectively, the first one was intended to write workload activity into a file on disk and the second one aimed identifying quickly opened transactions.
ADD EVENT sqlserver.database_transaction_begin(
ACTION(sqlserver.database_id,sqlserver.session_id,sqlserver.tsql_stack)),
ADD EVENT sqlserver.database_transaction_end(
ACTION(sqlserver.database_id,sqlserver.session_id,sqlserver.tsql_stack)),
ADD EVENT sqlserver.error_reported(
ACTION(sqlserver.database_id,sqlserver.session_id,sqlserver.tsql_stack)),
ADD EVENT sqlserver.module_end(
ACTION(sqlserver.database_id,sqlserver.session_id,sqlserver.tsql_stack)),
ADD EVENT sqlserver.module_start(
ACTION(sqlserver.database_id,sqlserver.session_id,sqlserver.sql_text,sqlserver.tsql_stack)),
ADD EVENT sqlserver.rpc_completed(
ACTION(sqlserver.database_id,sqlserver.session_id,sqlserver.tsql_stack)),
ADD EVENT sqlserver.rpc_starting(
ACTION(sqlserver.database_id,sqlserver.session_id,sqlserver.sql_text,sqlserver.tsql_stack)),
ADD EVENT sqlserver.sp_statement_completed(
ACTION(sqlserver.database_id,sqlserver.session_id,sqlserver.tsql_stack)),
ADD EVENT sqlserver.sp_statement_starting(
ACTION(sqlserver.database_id,sqlserver.session_id,sqlserver.sql_text,sqlserver.tsql_stack)),
ADD EVENT sqlserver.sql_statement_completed(
ACTION(sqlserver.database_id,sqlserver.session_id,sqlserver.tsql_stack)),
ADD EVENT sqlserver.sql_statement_starting(
ACTION(sqlserver.database_id,sqlserver.session_id,sqlserver.sql_text,sqlserver.tsql_stack))
ADD TARGET package0.event_file(SET filename=N'OrphanedTransactionHunter'),
ADD TARGET package0.pair_matching(SET begin_event=N'sqlserver.database_transaction_begin',begin_matching_actions=N'sqlserver.session_id',end_event=N'sqlserver.database_transaction_end',end_matching_actions=N'sqlserver.session_id',respond_to_memory_pressure=(1))
WITH (MAX_MEMORY=4096 KB,EVENT_RETENTION_MODE=ALLOW_SINGLE_EVENT_LOSS,MAX_DISPATCH_LATENCY=5 SECONDS,MAX_EVENT_SIZE=0 KB,MEMORY_PARTITION_MODE=NONE,TRACK_CAUSALITY=ON,STARTUP_STATE=OFF)
GO
The outputs were as follows:
> Target histogram (with opened transactions)

The only transaction that remained opened during our test (just be careful other noisy records not relevant at the moment when you start the XE session) concerned the session_id = 873. The attach_activity_id, attach_activity_id_xfer and session column values were helpful here to correlate events recorded to the event file target.
> Event File (Workload activity)
Here the events after applying a filter with above values.
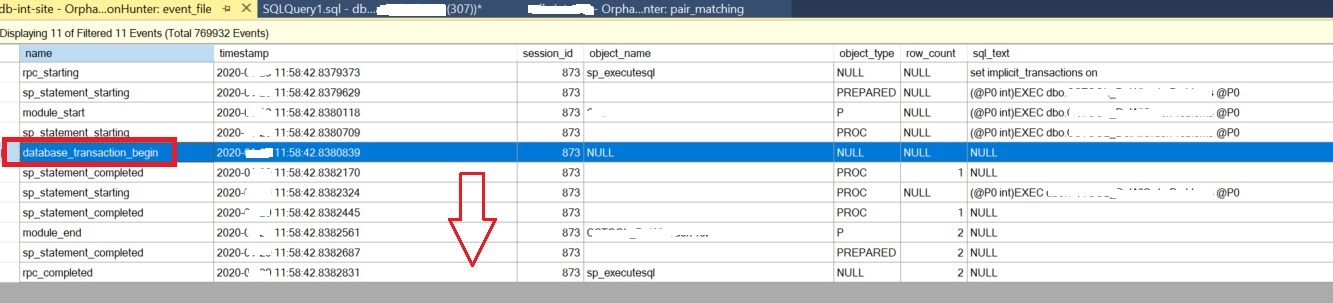
We noticed the transaction with session_id = 873 was started but never ended. In addition, we were able to identify the sequence of code executed by the application (mainly based on prepared statement and stored procedures in our context).This information helps the DEV team to focus on the right portion of code to fix. Without getting into details, it was very interesting to see this root cause was a SQL statement and duplicate key issue not thrown and managed correctly by the application. I was just surprised the application didn’t catch any errors in a such case. We finally understood that prepared statements and stored procedure calls were done through the DButils class including the closeQuietly() method to close connections. Referring to the Apache documentation, closeQuietly() was designed to hide SQL Exceptions when happen which definitely not help identifying easily the issue from an application side. Never mind, thanks to the collaboration with the DEV team we managed to get rid of this issue ![]()
David Barbarin
Ping : 1leviticus