
Columnstore indexes are a very nice feature and well-suited for analytics queries. Using them for our datawarehouse helped to accelerate some big ETL processing and to reduce resource footprint such as CPU, IO and memory as well. In addition, SQL Server 2016 takes columnstore index to a new level and allows a fully updateable non-clustered columnstore index on a rowstore table making possible operational and analytics workloads. Non-clustered columnstore index are a different beast to manage with OLTP workload and we got both good and bad experiences on it. In this blog post, let’s talk about good effects and an interesting case where we use them for reducing CPU consumption of a big reporting query.
In fact, the concerned query follows a common T-SQL anti-pattern for performance: A complex layer of nested views and CTEs which are an interesting mix to getting chances to prevent a cleaned-up execution plan. The SQL optimizer gets tricked easily in this case. So, for illustration let’s start with the following query pattern:
SELECT col ..., SUM(col2), ...
FROM [VIEW]
GROUP BY col ...
),
CTE2 AS (
SELECT col ..., ROW_NUMBER()
FROM (
SELECT col ...
JOIN CTE1 ON ...
JOIN [VIEW2] ON ...
JOIN [TABLE] ON ...
) AS VT
),
CTE3 A (
SELECT col ...
FROM [VIEW]
JOIN [VIEW4] ON ...
)
...
SELECT col ...
FROM (
SELECT
col,
STUFF((SELECT '', '' + col
FROM CTE2
WHERE CTE2.ID = CTE1.ID
FOR XML PATH('''')), 1, 1, '''') AS colconcat,
...
FROM (
SELECT col ...
FROM CTE1
LEFT JOIN CTE2 ON ...
LEFT JOIN (
SELECT col
FROM CTE3
GROUP BY col
) AS T1 ON ...
) AS T2
GROUP BY col ...
)
Sometimes splitting the big query into small pieces and storing pre-aggregation within temporary tables may help. This is what it has been done and led to some good effects with a global reduction of the query execution time.
CREATE TABLE #T2 ...
CREATE TABLE #T3 ...
;WITH CTE1 AS (
SELECT col ..., SUM(col2), ...
FROM [VIEW]
GROUP BY col ...
)
INSERT INTO #T1 ...
SELECT col FROM CTE1 ...
;
WITH CTE2 AS (
SELECT col ..., ROW_NUMBER()
FROM (
SELECT col ...
JOIN #T1 ON ...
JOIN [VIEW2] ON ...
JOIN [TABLE] ON ...
) AS VT
)
INSERT INTO #T2 ...
SELECT col FROM CTE2 ...
;
WITH CTE3 A (
SELECT col ...
FROM [VIEW]
JOIN [VIEW4] ON ...
)
INSERT INTO #T3 ...
SELECT col FROM CTE3 ...
;
SELECT col ...
FROM (
SELECT
col,
STUFF((SELECT '', '' + col
FROM CTE2
WHERE CTE2.ID = CTE1.ID
FOR XML PATH('''')), 1, 1, '''') AS colconcat,
...
FROM (
SELECT col ...
FROM #T1
LEFT JOIN #T2 ON ...
LEFT JOIN (
SELECT col
FROM #T3
GROUP BY col
) AS T1 ON ...
) AS T2
GROUP BY col ...
)
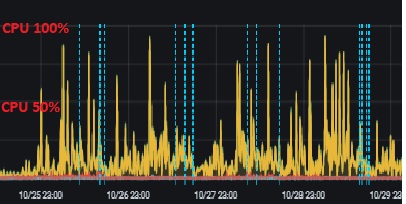
However, it was not enough, and the query continued to consume a lot of CPU time as shown below:

CPU time was around 20s per execution. CPU time is greater than duration time due to parallelization. Regarding the environment you are, you would say having such CPU time can be common for reporting queries and you’re probably right. But let’s say in my context where all reporting queries are offloaded in a secondary availability group replica (SQL Server 2017), we wanted to keep the read only CPU footprint as low as possible to guarantee a safety margin of CPU resources to address scenarios where all the traffic (including both R/W and R/O queries) is redirected to the primary replica (maintenance, failure and so on). The concerned report is executed on-demand by users and mostly contribute to create high CPU spikes among other reporting queries as shown below:
Testing this query on DEV environment gave following statistic execution outcomes:
SQL Server Execution Times:
CPU time = 12988 ms, elapsed time = 6084 ms.
SQL Server parse and compile time:
CPU time = 0 ms, elapsed time = 0 ms.
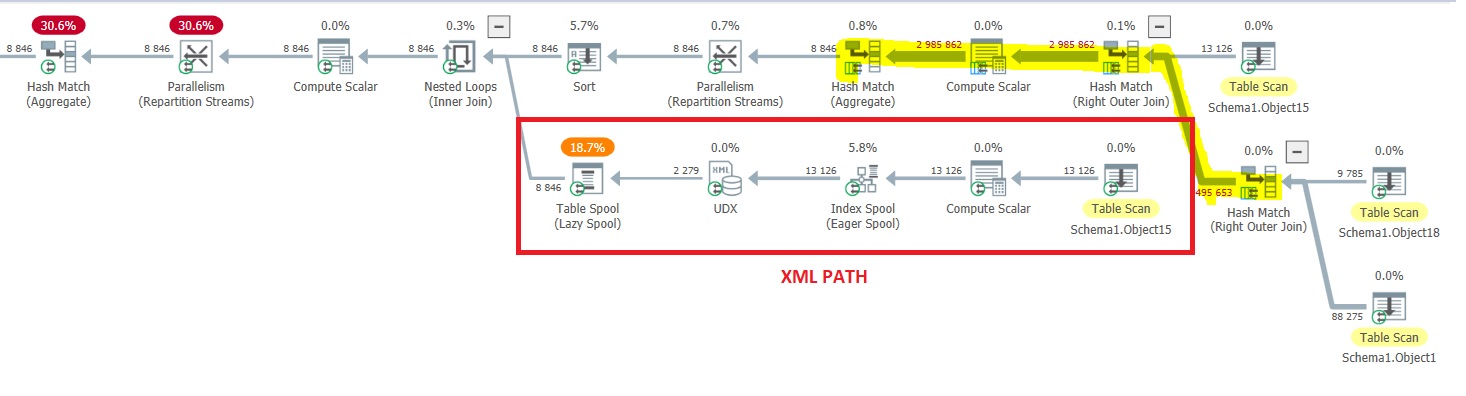
… with the related execution plan (not estimated). In fact, I put only the final SELECT step because it was the main culprit of high CPU consumption for this query – (plan was anonymized by SQL Sentry Plan Explorer):

Real content of the query doesn’t matter for this write-up, but you probably have noticed I put explicitly concatenation stuff with XML PATH construct previously and I identified the execution path in the query plan above. This point will be important in the last section of this write-up.
First, because CPU is my main concern, I only selected CPU cost and you may notice top consumers are repartition streams and hash match operators followed by Lazy spool used with XML PATH and correlated subquery.
Then rewriting the query could be a good option but we first tried to find out some quick wins to avoid engaging too much time for refactoring stuff. Focusing on the different branches of this query plan and operators engaged from the right to the left, we make assumption that experimenting batch mode could help reducing the overall CPU time on the highlighted branch. But because we are not dealing with billion of rows within temporary tables, we didn’t want to get extra overhead of maintaining compressed columnstore index structure. I remembered reading an very interesting article in 2016 about the creation of dummy non-clustered columnstore indexes (NCCI) with filter capabilities to enable batch mode and it seemed perfectly fit with our scenario. In parallel, we went through inline index creation capabilities to neither trigger recompilation of the batch statement nor to prevent temp table caching. The target is to save CPU time ![]()
So, the temp table and inline non-clustered columnstore index DDL was as follows:
CREATE TABLE #T2 ( col ..., INDEX CCI_IDX_T2 NONCLUSTERED COLUMNSTORE (col) ) WHERE col < 1
CREATE TABLE #T3 ( col ..., INDEX CCI_IDX_T3 NONCLUSTERED COLUMNSTORE (col) ) WHERE col < 1
…
Note the WHERE clause here with an out-of-range value to create an empty NCCI.
After applying the changes here, the new statistic execution metrics we got:
SQL Server Execution Times:
CPU time = 2842 ms, elapsed time = 6536 ms.
SQL Server parse and compile time:
CPU time = 0 ms, elapsed time = 0 ms.
… and the related execution plan:
A drop of CPU time consumption (2.8s vs 12s) per execution when the batch mode kicked-in. A good news for sure but something continued to draw my attention because even if batch mode came into play here, it was not propagated to the left and seem to stop at the level of XML PATH execution. After reading my preferred reference on this topic (thank you Niko), I was able to confirm my suspicion of unsupported XML operation with batch mode. Unfortunately, I was out of luck to confirm with column_store_expression_filter_apply extended event that seem to not work for me.
Well, to allow the propagation of batch mode to the left side of the execution plan, it was necessary to write and move the correlated subquery with XML path to a simple JOIN and STRING_AGG() function – available since SQL Server 2016:
SELECT
col,
STUFF((SELECT '', '' + col
FROM CTE2
WHERE CTE2.col = CTE1.col
FOR XML PATH('''')), 1, 1, '''') AS colconcat,
...
FROM [TABLE]
-- Concat with STRING_AGG
SELECT
col,
V.colconcat,
...
FROM [TABLE] AS T
JOIN (
SELECT
col,
STRING_AGG(col2, ', ') AS colconcat
FROM #T2
GROUP BY col
) AS V ON V.col = T.col
The new change gave this following outcome:
SQL Server Execution Times:
CPU time = 2109 ms, elapsed time = 1872 ms.
and new execution plan:

First, batch mode is now propagated from the right to the left of the query execution plan because we eliminated all inhibitors including XML construct. We got not real CPU reduction this time, but we managed to reduce global execution time. The hash match aggregate operator is the main CPU consumer and it is the main candidate to benefit from batch mode. All remaining operators on the left side process few rows and my guess is that batch mode may appear less efficient than with the main consumer in this case. But anyway, note we also got rid of the Lazy Spool operator with the refactoring of the XML path and correlated subquery by STRING_AGG() and JOIN construct.
![]()
The new result is better by far compared to the initial scenario (New CPU time: 3s vs Old CPU Time: 20s). It also had good effect of the overall workload on the AG read only replica:
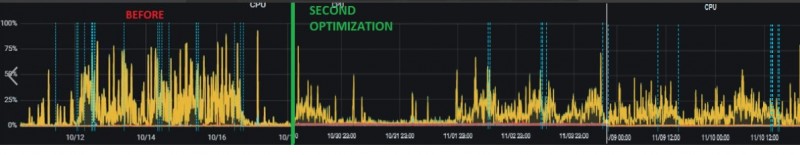
Not so bad for a quick win!
See you
Ping : 3influenza