
During this year, I spent a part of my job on understanding the processes and concepts around monitoring in my company. The DevOps mindset mainly drove the idea to move our SQL Server monitoring to the existing Prometheus and Grafana infrastructure. Obviously, there were some technical decisions behind the scene, but the most important part of this write-up is dedicated to explaining other and likely most important reasons of this decision.
But let’s precise first, this write-up doesn’t constitute any guidance or any kind of best practices for DBAs but only some sharing of my own experience on the topic. As usual, any comment will be appreciated.
That’s said, let’s continue with the context. At the beginning of this year, I started my new DBA position in a customer-centric company where DevOps culture, microservices and CI/CD are omnipresent. What does it mean exactly? To cut the story short, development and operation teams are used a common approach for agile software development and delivery. Tools and processes are used to automate build, test, deploy and to monitor applications with speed, quality and control. In other words, we are talking about Continuous Delivery and in my company, release cycle is faster than traditional shops I encountered so far with several releases per day including database changes. Another interesting point is that we are following the « Operate what you build » principle each team that develops a service is also responsible for operating and supporting it. It presents some advantages for both developers and operations but pushing out changes requires to get feedback and to observe impact on the system on both sides.
In addition, in operation teams we try to act as a centralized team and each member should understand the global scope and topics related to the infrastructure and its ecosystem. This is especially true when you’re dealing with nightly on-calls. Each has its own segment responsibility (regarding their specialized areas) but following DevOps principles, we encourage shared ownership to break down internal silos for optimizing feedback and learning. It implies anyone should be able to temporarily overtake any operational task to some extent assuming the process is well-documented, and learnin has been done correctly. But world is not perfect and this model has its downsides. For example, it will prioritize effectiveness in broader domains leading to increase cognitive load of each team member and to lower visibility in for vertical topics when deeper expertise is sometimes required. Having an end-to-end observable system including infrastructure layer and databases may help to reduce time for investigating and fixing issues before end users experience them.
The initial scenario
Let me give some background info and illustration of the initial scenario:
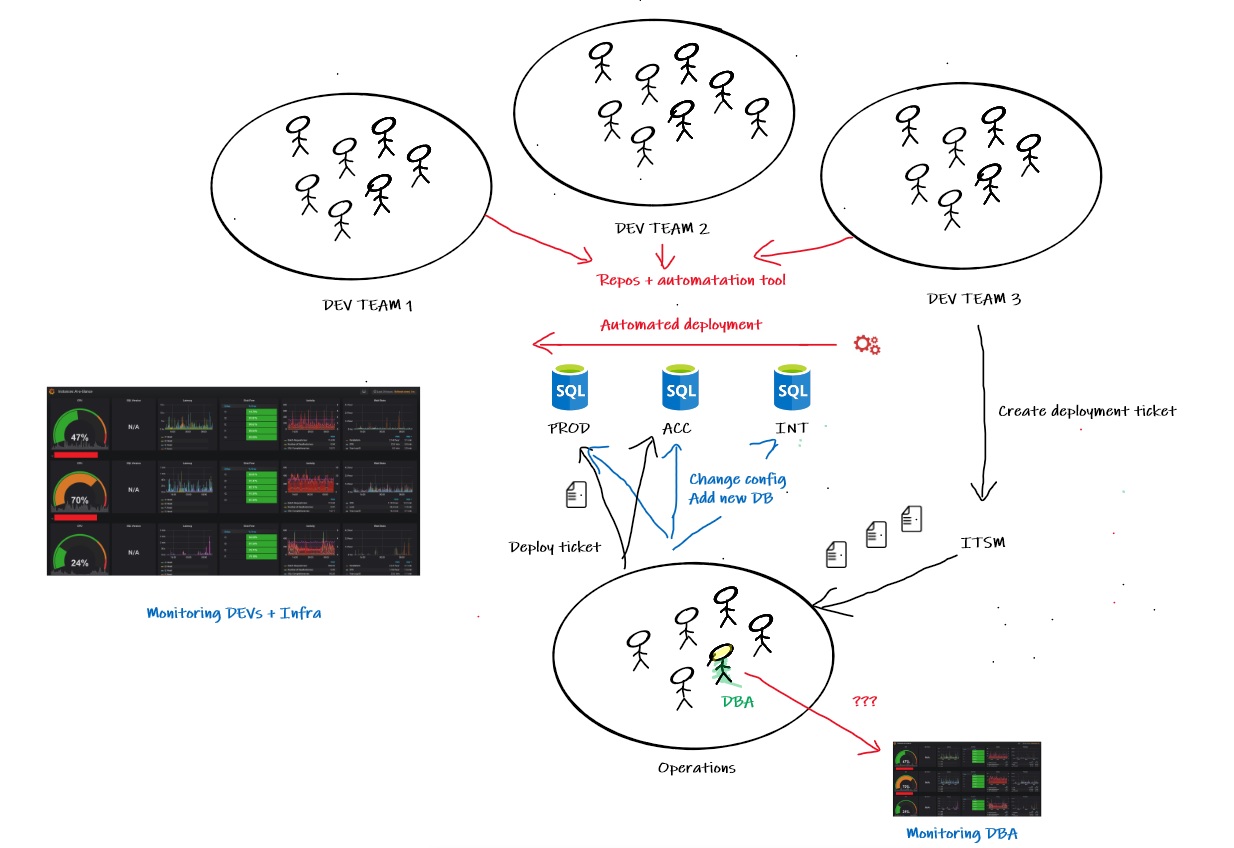
… and my feeling of what could be improved:
1) From a DBA perspective, at a first glance there are many potential issues. Indeed, a lot of automated or semi-manual deployment processes are out of the control and may have a direct impact on the database environment stability. Without better visibility, there is likely no easy way to address the famous question: He, we are experiencing performance degradations for two days, has something happened on database side?
2) Silos are encouraged between DBA and DEVs in this scenario. Direct consequence is to limit drastically the adding value of the DBA role in a DevOps context. Obviously, primary concerns include production tasks like ensuring integrity, backups and maintenance of databases. But in a DevOps oriented company where we have automated « database-as-code » pipelines, they remain lots of unnecessary complexity and disruptive scripts that DBA should take care. If this role is placed only at the end of the delivery pipeline, collaboration and continuous learning with developer teams will restricted at minimum.
3) There is a dedicated monitoring tool for SQL Server infrastructure and this is a good point. It provides necessary baselining and performance insights for DBAs. But in other hand, the tool in place targets only DBA profiles and its usage is limited to the infrastructure team. This doesn’t contribute to help improving the scalability in the operations team and beyond. Another issue with the existing tooling is correlation can be difficult with external events that come from either the continuous delivery pipeline or configuration changes performed by operations teams on the SQL Server instances. In this case, establishment of observability (the why) may be limited and this is what teams need to respond quickly and resolve emergencies in modern and distributed software.
What is observability?
You probably noticed the word « observability » in my previous sentence, so I think it deserves some explanations before to continue. Observability might seem like a buzzword but in fact it is not a new concept but became prominent in DevOps software development lifecycle (SDLC) methodologies and distributed infrastructure systems. Referring to the Wikipedia definition, Observability is the ability to infer internal states of a system based on the system’s external outputs. To be honest, it has not helped me very much and further readings were necessary to shed the light on what observability exactly is and what difference exist with monitoring.
Let’s start instead with monitoring which is the ability to translate infrastructure log metrics data into meaningful and actionable insights. It helps knowing when something goes wrong and starting your response quickly. This is the basis for monitoring tool and the existing one is doing a good job on it. In DBA world, monitoring is often related to performance but reporting performance is only as useful as that reporting accurately represents the internal state of the global system and not only your database environment. For example, in the past I went to some customer shops where I was in charge to audit their SQL Server infrastructure. Generally, customers were able to present their context, but they didn’t get the possibility to provide real facts or performance metrics of their application. In this case, you usually rely on a top-down approach and if you’re either lucky or experimented enough, you manage to find what is going wrong. But sometimes I got relevant SQL Server metrics that would have highlighted a database performance issue, but we didn’t make a clear correlation with those identified on application side. In this case, relying only on database performance metrics was not enough for inferring the internal state of the application. From my experience, many shops are concerned with such applications that have been designed for success and not for failure. They often lake of debuggability monitoring and telemetry is often missing. Collecting data is as the base of observability.
Observability provides not only the when of an error or issue, but more importantly the why. With modern software architectures including micro-services and the emphasis of DevOps, monitoring goals are no longer limited to collecting and processing log data, metrics, and event traces. Instead, it should be employed to improve observability by getting a better understanding of the properties of an application and its performance across distributed systems and delivery pipeline. Referring to the new context I’m working now, metric capture and analysis is started with deployment of each micro-service and it provides better observability by measuring all the work done across all dependencies.
White-Box vs. Black-Box Monitoring
In my company as many other companies, different approaches are used when it comes monitoring: White-box and Black-Box monitoring.
White-box monitoring focuses on exposing internals of a system. For example, this approach is used by many SQL Server performance tools on the market that make effort to set a map of the system with a bunch of internal statistic data about index or internal cache usage, existing wait stats, locks and so on …
In contrast, black-Box monitoring is symptom oriented and tests externally visible behavior as a user would see it. Goal is only monitoring the system from the outside and seeing ongoing problems in the system. There are many ways to achieve black-box monitoring and the first obvious one is using probes which will collect CPU or memory usage, network communications, HTTP health check or latency and so on … Another option is to use a set of integration tests that run all the time to test the system from a behavior / business perspective.
White-Box vs. Black-Box Monitoring: Which is finally more important? All are and can work together. In my company, both are used at different layers of the micro-service architecture including software and infrastructure components.
RED vs USE monitoring
When you’re working in a web-oriented and customer-centric company, you are quickly introduced to The Four Golden Signals monitoring concept which defines a series of metrics originally from Google Site Reliability Engineering including latency, traffic, errors and saturation. The RED method is a subset of “Four Golden Signals” and focus on micro-service architectures and include following metrics:
- Rate: number of requests our service is serving per second
- Error: number of failed requests per second
- Duration: amount of time it takes to process a request
Those metrics are relatively straightforward to understand and may reduce time to figure out which service was throwing the errors and then eventually look at the logs or to restart the service, whatever.
For HTTP Metrics the RED Method is a good fit while the USE Method is more suitable for infrastructure side where main concern is to keep physical resources under control. The latter is based on 3 metrics:
- Utilization: Mainly represented in percentage and indicates if a resource is in underload or overload state.
- Saturation: Work in a queue and waiting to be processed
- Errors: Count of event errors
Those metrics are commonly used by DBAs to monitor performance. It is worth noting that utilization metric can be sometimes misinterpreted especially when maximum value depends of the context and can go over 100%.
SQL Server infrastructure monitoring expectations
Referring to the starting scenario and all concepts surfaced above, it was clear for us to evolve our existing SQL Server monitoring architecture to improve our ability to reach the following goals:
- Keeping analyzing long-term trends to respond usual questions like how my daily-workload is evolving? How big is my database? …
- Alerting to respond for a broken issue we need to fix or for an issue that is going on and we must check soon.
- Building comprehensive dashboards – dashboards should answer basic questions about our SQL Server instances, and should include some form of the advanced SQL telemetry and logging for deeper analysis.
- Conducting an ad-hoc retrospective analysis with easier correlation: from example an http response latency that increased in one service. What happened around? Is-it related to database issue? Or blocking issue raised on the SQL Server instance? Is it related to a new query or schema change deployed from the automated delivery pipeline? In other words, good observability should be part of the new solution.
- Automated discovery and telemetry collection for every SQL Server instance installed on our environment, either on VM or in container.
- To rely entirely on the common platform monitoring based on Prometheus and Grafana. Having the same tooling make often communication easier between people (human factor is also an important aspect of DevOps)
Prometheus, Grafana and Telegraf
Prometheus and Grafana are the central monitoring solution for our micro-service architecture. Some others exist but we’ll focus on these tools in the context of this write-up.
Prometheus is an open-source ecosystem for monitoring and alerting. It uses a multi-dimensional data model based on time series data identified by metric name and key/value pairs. WQL is the query language used by Prometheus to aggregate data in real time and data are directly shown or consumed via HTTP API to allow external system like Grafana. Unlike previous tooling, we appreciated collecting SQL Server metrics as well as those of the underlying infrastructure like VMWare and others. It allows to comprehensive picture of a full path between the database services and infrastructure components they rely on.
Grafana is an open source software used to display time series analytics. It allows us to query, visualize and generate alerts from our metrics. It is also possible to integrate a variety of data sources in addition of Prometheus increasing the correlation and aggregation capabilities of metrics from different sources. Finally, Grafana comes with a native annotation store and the ability to add annotation events directly from the graph panel or via the HTTP API. This feature is especially useful to store annotations and tags related to external events and we decided to use it for tracking software releases or SQL Server configuration changes. Having such event directly on dashboard may reduce troubleshooting effort by responding faster to the why of an issue.
For collecting data we use Telegraf plugin for SQL Server. The plugin exposes all configured metrics to be polled by a Prometheus server. The plugin can be used for both on-prem and Azure instances including Azure SQL DB and Azure SQL MI. Automated deployment and configuration requires low effort as well.
The high-level overview of the new implemented monitoring solution is as follows:

SQL Server telemetry is achieved through Telegraf + Prometheus and includes both Black-box and White-box oriented metrics. External events like automated deployment, server-level and database-level configuration changes are monitored through a centralized scheduled framework based on PowerShell. Then annotations + tags are written accordingly to Grafana and event details are recorded to logging tables for further troubleshooting.
Did the new monitoring met our expectations?
Well, having experienced the new monitoring solution during this year, I would say we are on a good track. We worked mainly on 2 dashboards. The first one exposes basic black-box metrics to show quickly if something is going wrong while the second one is DBA oriented with a plenty of internal counters to dig further and to perform retrospective analysis.
Here a sample of representative issues we faced this year and we managed to fix with the new monitoring solution:
1) Resource pressure and black-box monitoring in action:
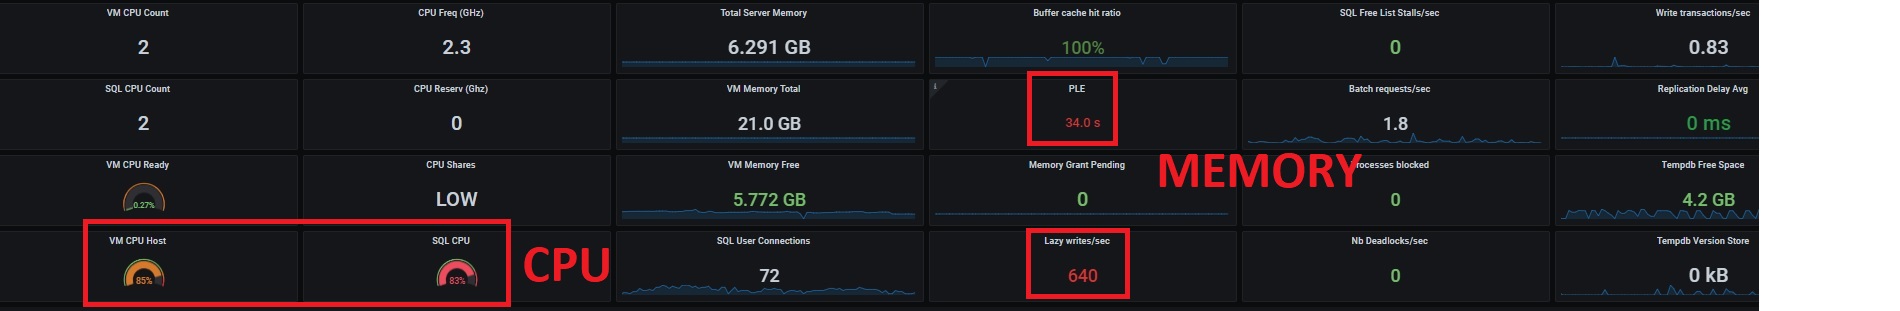
For this scenario, the first dashboard highlighted resource pressure issues, but it is worth noting that even if the infrastructure was burning, users didn’t experience any side effects or slowness on application side. After corresponding alerts raised on our side, we applied proactive and temporary fixes before users experience them. I would say, this scenario is something we would able to manage with previous monitoring and the good news is we didn’t notice any regression on this topic.
2) Better observability for better resolution of complex issue
This scenario was more interesting because the first symptom started from the application side without alerting the infrastructure layer. We started suffering from HTTP request slowness on November around 12:00am and developers got alerted with sporadic timeout issues from the logging system. After they traversed the service graph, they spotted on something went wrong on the database service by correlating http slowness with blocked processes on SQL Server dashboard as shown below. I put a simplified view on the dashboards, but we need to cross several routes between the front-end services and databases.
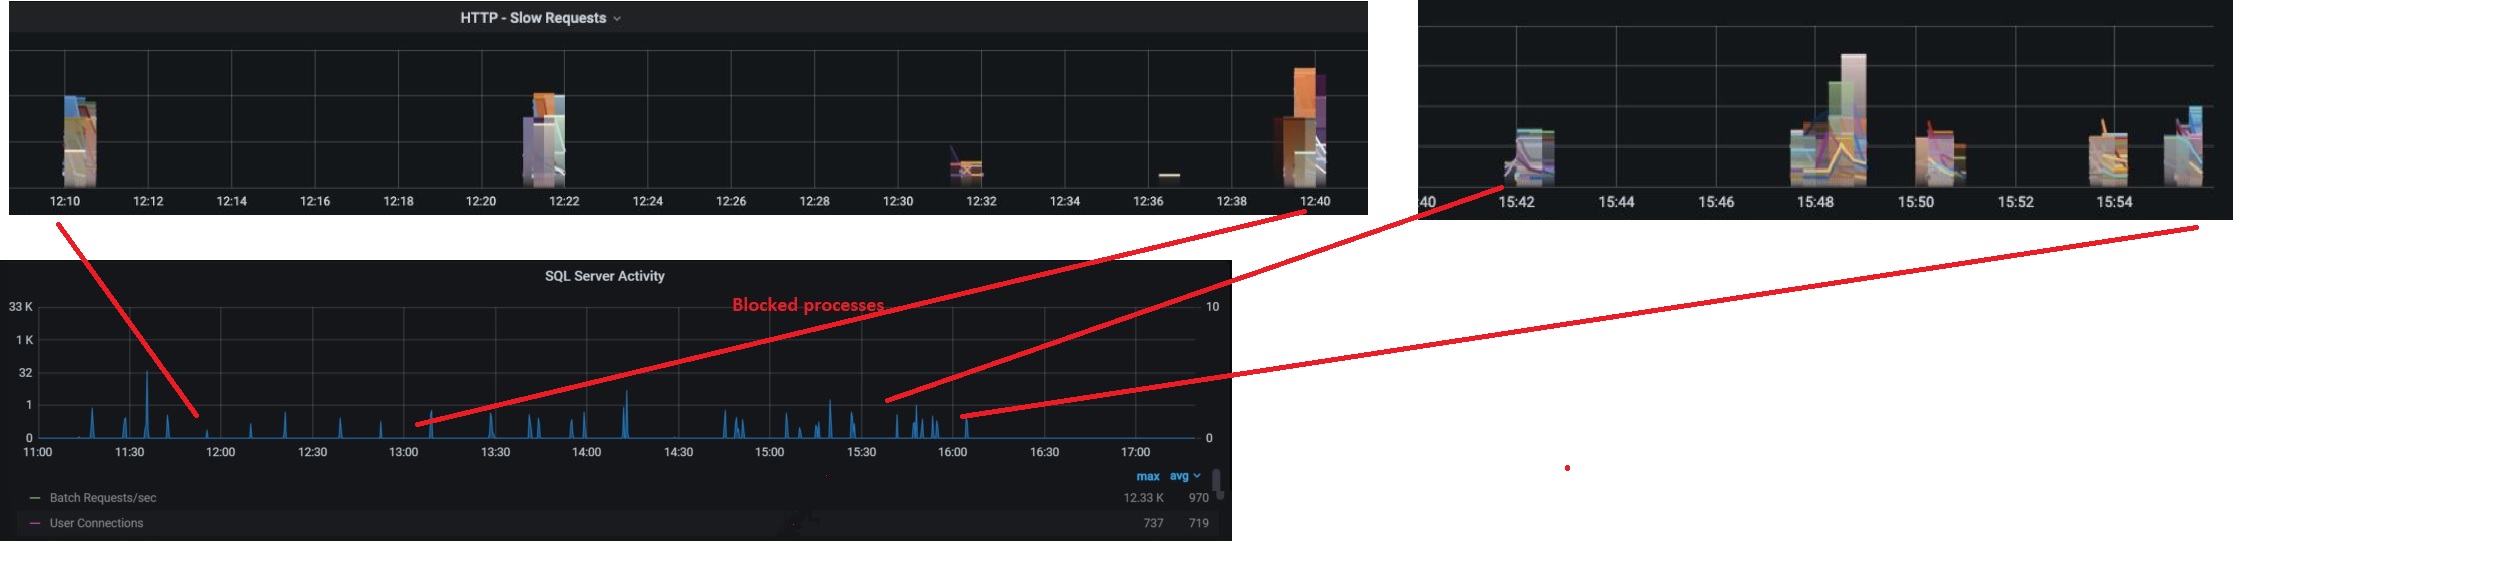
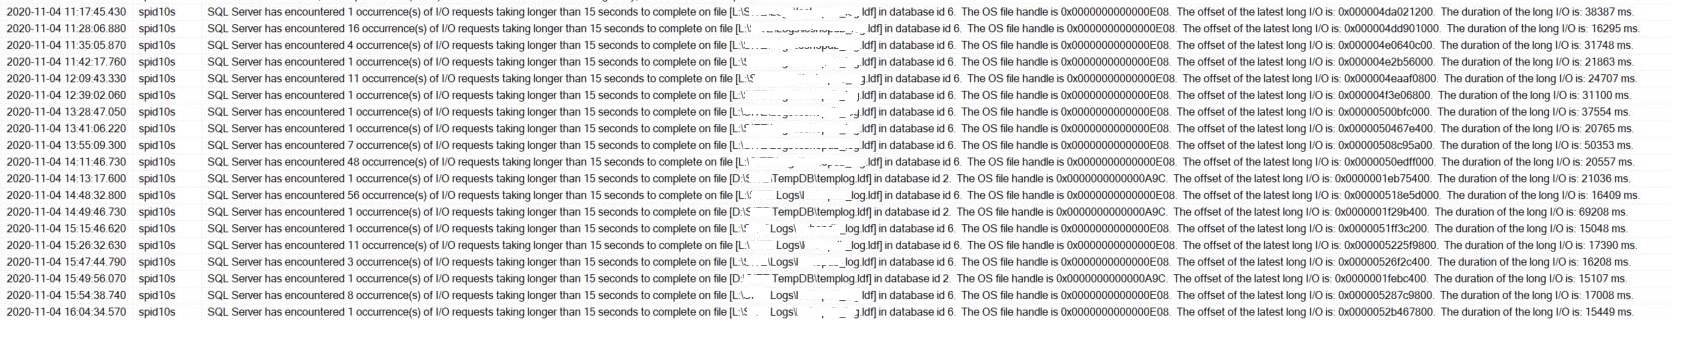
Then I got a call from them and we started investigating blocking processes from the logging tables in place on SQL Server side. At a first glance, different queries with a longer execution time than usual and neither release deployments nor configuration updates may explain such sudden behavior change. The issue kept around and at 15:42 it started appearing more frequently to deserve a deeper look at the SQL Server internal metrics. We quickly found out some interesting correlation with other metrics and we finally managed to figure out why things went wrong as show below:
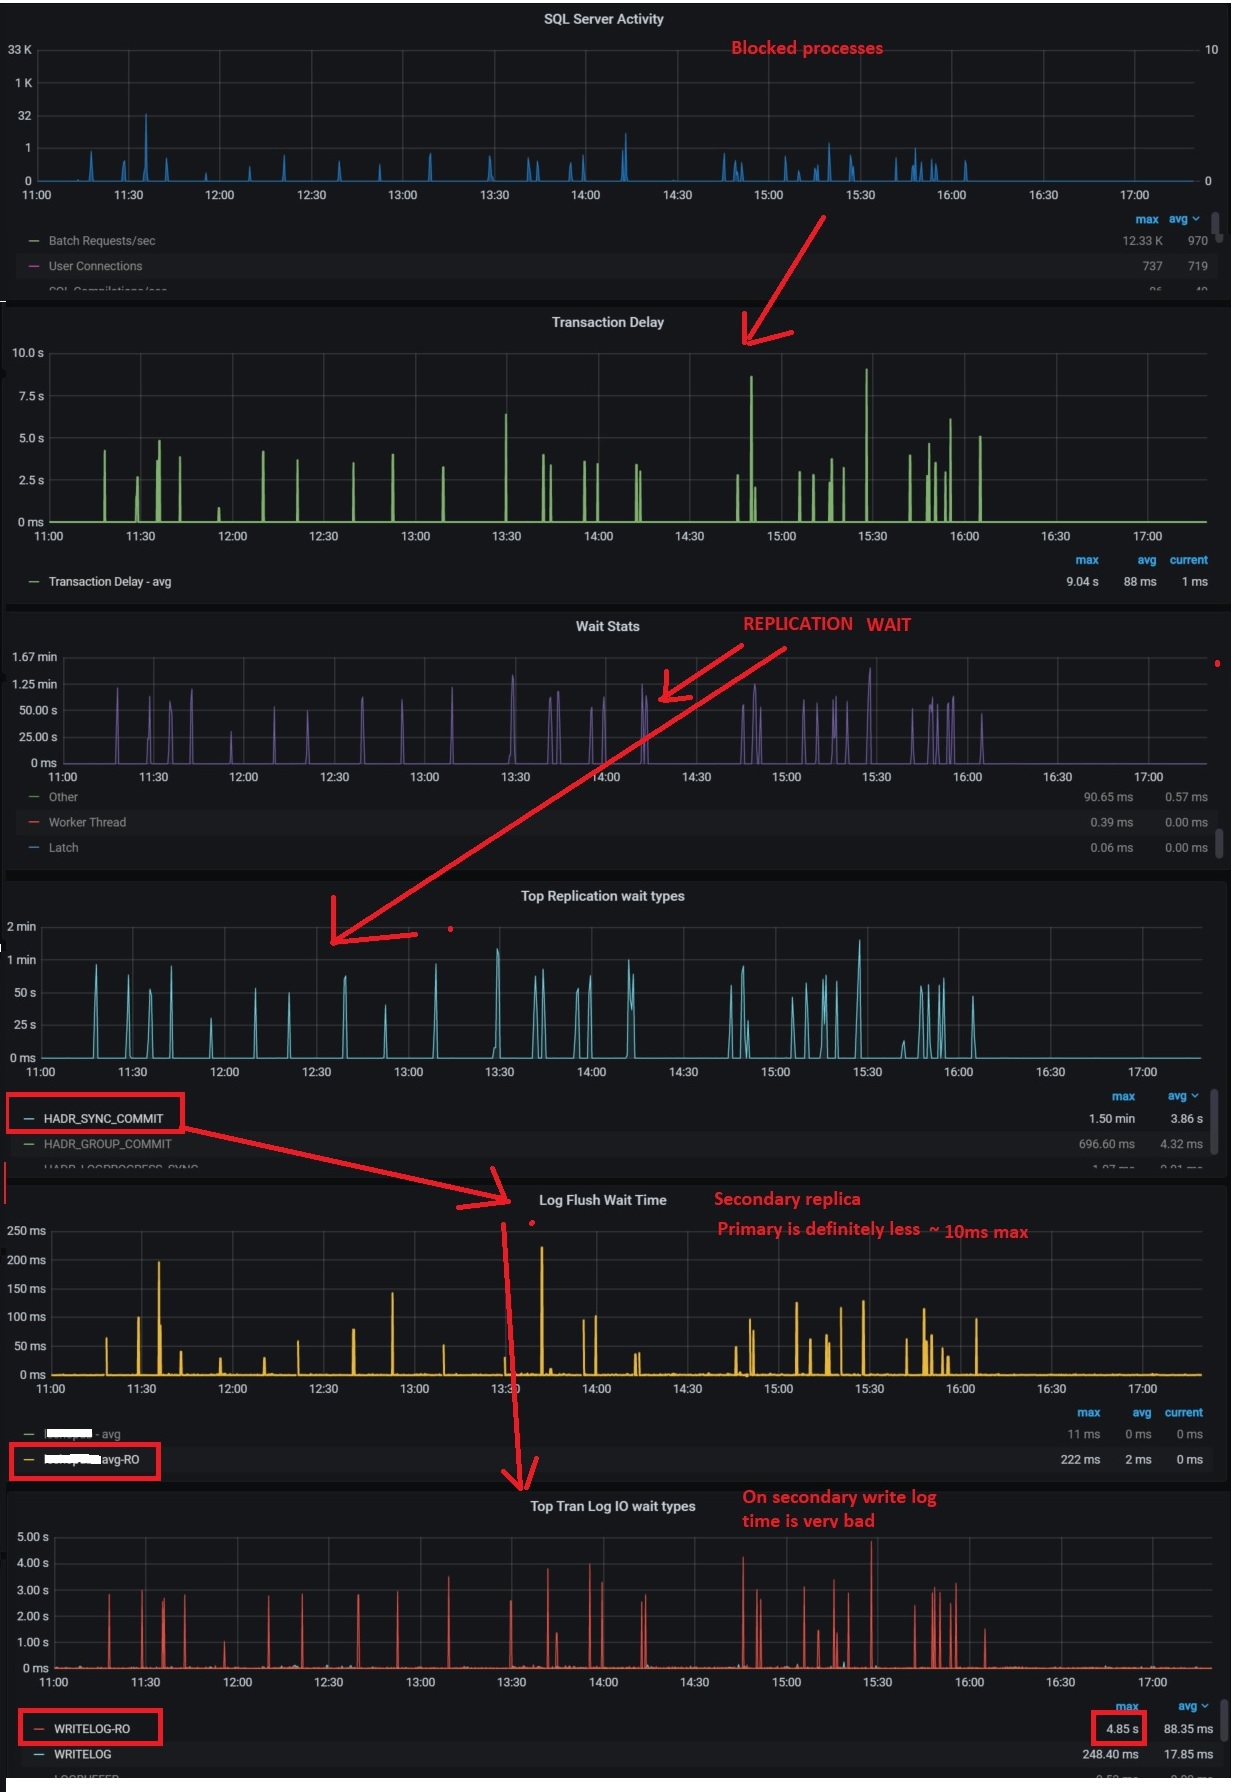
Root cause was related to transaction replication slowness within Always On availability group databases and we directly jumped on storage issue according to error log details on secondary:
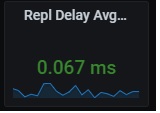
End-to-End observability by including the database services to the new monitoring system drastically reduces the time for finding the root cause. But we also learnt from this experience and to continuously improve the observability we added a black-box oriented metric related to availability group replication latency (see below) to detect faster any potential issue.
And what’s next?
Having such monitoring is not the endpoint of this story. As said at the beginning of this write-up, continuous delivery comes with its own DBA challenges illustrated by the starting scenario. Traditionally the DBA role is siloed, turning requests or tickets into work and they can be lacking context about the broader business or technology used in the company. I experienced myself several situations where you get alerted during the night when developer’s query exceeds some usage threshold. Having discussed the point with many DBAs, they tend to be conservative about database changes (normal reaction?) especially when you are at the end of the delivery process without clear view of what will could deployed exactly.
Here the new situation:

Implementing new monitoring stuff changed the way to observe the system (at least from a DBA perspective). Again, I believe the adding value of DBA role in a company with a strong DevOps mindset is being part of both production DBAs and Development DBAs. Making observability consistent across all the delivery pipeline including databases is likely part of the success and may help DBA getting a broader picture of system components. Referring to my context, I’m now able to get more interaction with developer teams on early phases and to provide them contextual feedbacks (and not generic feedbacks) for improvements regarding SQL production telemetry. They also have access to them and can check by themselves impact of their development. In the same way, feedbacks and work with my team around database infrastructure topic may appear more relevant.
It is finally a matter of collaboration
Ping : 2drawings
Ping : Graphing SQL Server wait stats on Prometheus and Grafana | David Barbarin
Ping : Creating dynamic Grafana dashboard for SQL Server | David Barbarin
Ping : Azure monitor as observability platform for Azure SQL Databases | David Barbarin
Ping : Extending SQL Server monitoring with Raspberry PI and Lametric | David Barbarin