
In a previous blog post, I wrote about reasons we moved our monitoring of on-prem SQL Server instances on Prometheus and Grafana. But what about Cloud and database services?
We have different options and obviously in my company we thought first moving our Azure SQL Database workload telemetry on on-prem central monitoring infrastructure as well. But not to mention the main blocker which is the serverless compute tier because Telegraf Server agent would imply initiating a connection that could prevent auto-pausing the database or at least it would made monitoring more complex because it would supposed to have a predictable workload all the time.
The second option was to rely on Azure monitor which is a common platform for combining several logging, monitoring and dashboard solutions across a wide set of Azure resources. It is scalable platform, fully managed and provides a powerful query language and native features like alerts, if logs or metrics match specific conditions. Another important point is there is no vendor lock-in, with this solution, as we can always fallback to our self-hosted Prometheus and Grafana instances if neither computer tier doesn’t fit nor in case Azure Monitor might not be an option anymore!
Firstly, to achieve a good observability with Azure SQL Database we need to put both diagnostic telemetry and SQL Server audits events in a common Log Analytics workspace. A quick illustration below:
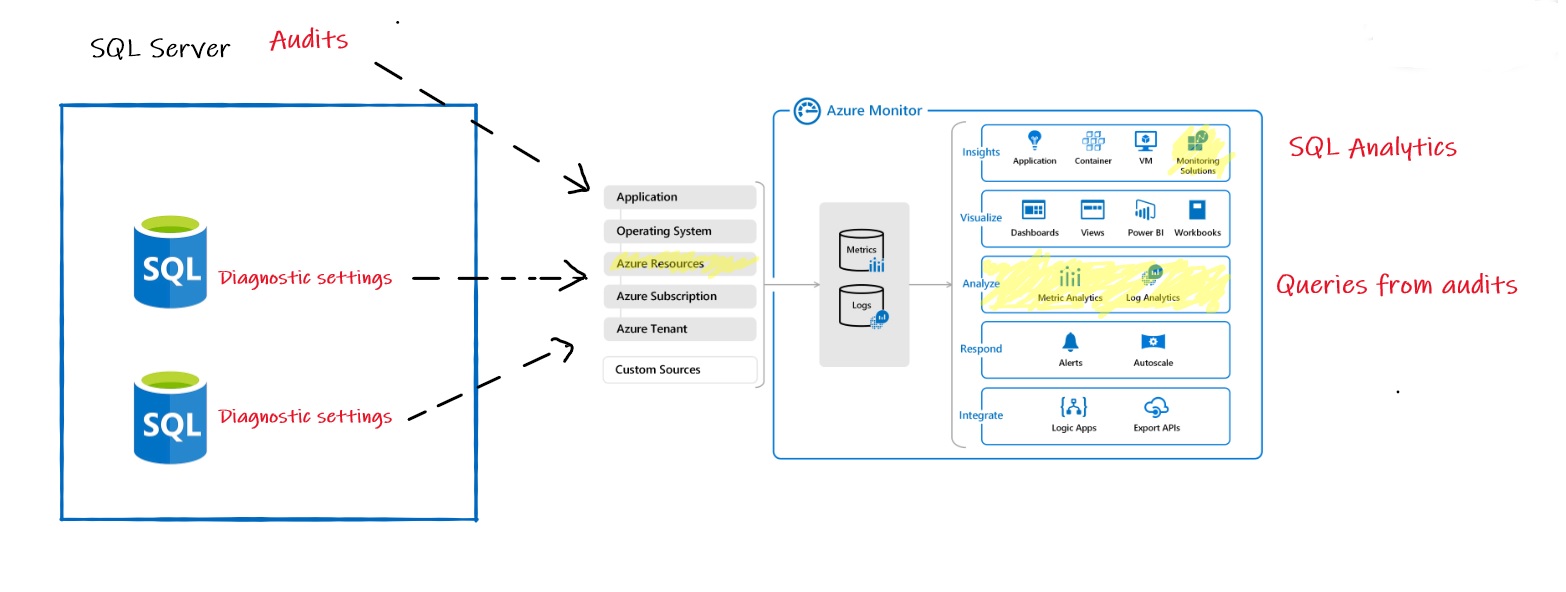
Diagnostic settings are configured per database and including basic metrics (CPU, IO, Memory etc …) and also different SQL Server internal metrics as deadlock, blocked processes or query store information about query execution statistic and waits etc… For more details please refer to the Microsoft BOL.
SQL Azure DB auditing is both server-level or database-level configuration setting. In our context, we defined a template of events at the server level which is then applied to all databases within the logical server. By default, 3 events are automatically audited:
– BATCH_COMPLETED_GROUP
– SUCCESSFUL_DATABASE_AUTHENTICATION_GROUP
– FAILED_DATABASE_AUTHENTICATION_GROUP
The first one of the list is probably to be discussed according to the environment because of its impact but in our context that’s ok because we faced a data warehouse workload. However we added other ones to meet our security requirements:
– PERMISSION_CHANGE_GROUP
– DATABASE_PRINCIPAL_CHANGE_GROUP
– DATABASE_ROLE_MEMBER_CHANGE_GROUP
– USER_CHANGE_PASSWORD_GROUP
But if you take care about Log Analytics as target for SQL audits, you will notice it is still a feature in preview as shown below:
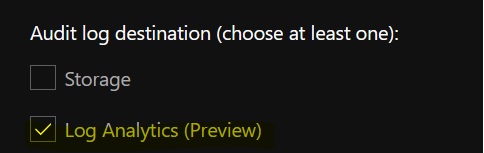
To be clear, usually we don’t consider using Azure preview features in production especially when they remain in this state for a long time but in this specific context we got interested by observability capabilities of the platform. From one hand, we get very useful performance insights through SQL Analytics dashboards (again in preview) and from the other hand we can easily query logs and traces through Log Analytics for correlation with other metrics. Obviously, we hope Microsoft moving a step further and providing this feature in GA in the near feature.
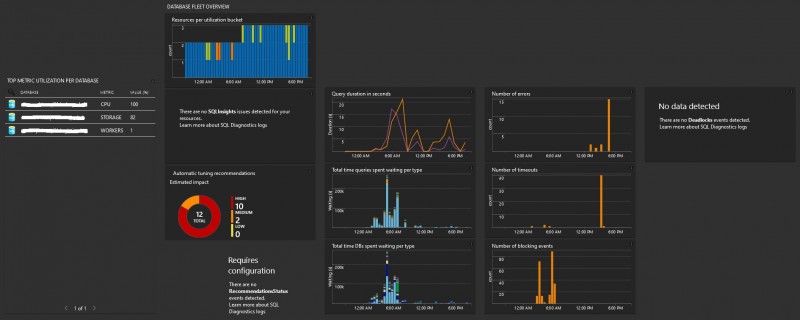
Let’s talk briefly of SQL Analytics first. It is an advanced and free cloud monitoring solution for Azure SQL database monitoring performance and it relies mainly on your Azure Diagnostic metrics and Azure Monitor views to present data in a structured way through performance dashboard.
Here an example of built-in dashboards we are using to track activity and high CPU / IO bound queries against our data warehouse.
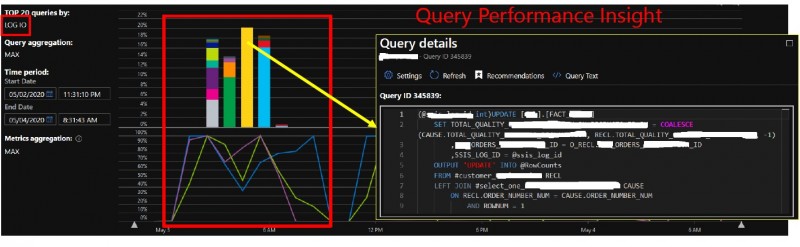
You can use drill-down capabilities to different contextual dashboards to get insights of resource intensive queries. For example, we identified some LOG IO intensive queries against a clustered columnstore index and after some refactoring of UPDATE statement to DELETE + INSERT we reduced drastically LOG IO waits.
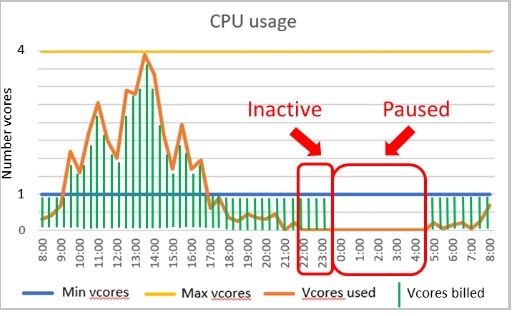
In addition, Azure monitor helped us in an another scenario where we tried to figure out recent workload patterns and to know if the current compute tier still fits with it. As said previously, we are relying on Serverless compute tier to handle the data warehouse-oriented workload with both auto-scaling and auto-pausing capabilities. At the first glance, we might expect a typical nightly workload as illustrated to Microsoft BOL and a cost optimized to this workload:
Images from Microsoft BOL
It could have been true when the activity started on Azure, but the game has changed with new incoming projects over the time. Starting with the general performance dashboard, the workload seems to follow the right pattern for Serverless compute tier, but we noticed billing keep going during unexpected timeframe as shown below. Let’s precise that I put deliberately only a sample of two days, but this pattern is a good representation of the general workload in our context.

Indeed, workload should be mostly nightly-oriented with sporadic activity during the day but quick correlation with other basic metrics like CPU or Memory percentage usage confirmed a persistent activity all day. We have CPU spikes and probably small batches that keep minimum memory around at other moments.
As per the Microsoft documentation, the minimum auto-pausing delay value is 1h and requires an inactive database (number of sessions = 0 and CPU = 0 for user workload) during this timeframe. Basic metrics didn’t provide any further insights about connections, applications or users that could generate such « noisy » activity, so we had to go another way by looking at the SQL Audit logs stored in Azure Monitor Logs. Data can be read through KQL which stands for Kusto Query Language (and not Kibana Query Language ![]() ). It’s the language used to query the Azure log databases: Azure Monitor Logs, Azure Monitor Application Insights and others and it is pretty similar to SQL language in the construct.
). It’s the language used to query the Azure log databases: Azure Monitor Logs, Azure Monitor Application Insights and others and it is pretty similar to SQL language in the construct.
Here the first query I used to correlate number of events with metrics and that could prevent auto-pausing to kick in for the concerned database including RPC COMPLETED, BATCH COMPLETED, DATABASE AUTHENTICATION SUCCEEDED or DATABASE AUTHENTICATION FAILED
| where Category == 'SQLSecurityAuditEvents' and (action_name_s in ('RPC COMPLETED','BATCH COMPLETED') or action_name_s contains "DATABASE AUTHENTICATION") and LogicalServerName_s == 'xxxx' and database_name_s == xxxx
| summarize count() by bin(event_time_t, 1h),action_name_s
| render columnchart
Results are aggregated and bucketized per hour on generated time event with bin() function. Finally, for a quick and easy read, I choosed a simple and unformatted column chart render. Here the outcome:
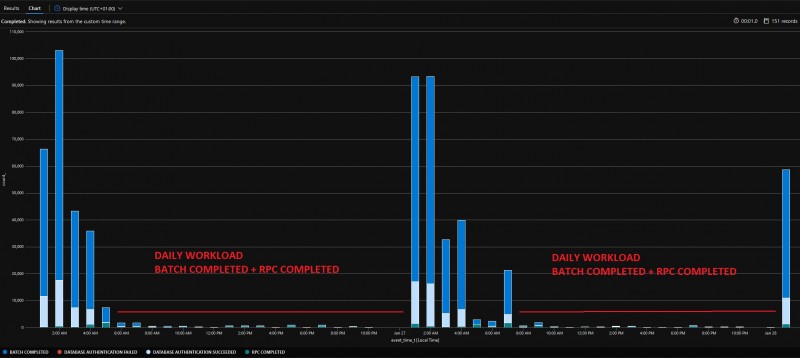
As you probably noticed, daily activity is pretty small compared to nightly one and seems to confirm SQL batches and remote procedure calls. From this unclear picture, we can confirm anyway the daily workload is enough to keep the billing going because there is no per hour timeframe where there is no activity.
Let’s write another KQL query to draw a clearer picture of which applications ran during the a daily timeframe 07:00 – 20:00:
let end=datetime("2021-01-29");
let dailystart=7;
let dailyend=20;
let timegrain=1d;
AzureDiagnostics
| project action_name_s, event_time_t, application_name_s, server_principal_name_s, Category, LogicalServerName_s, database_name_s
| where Category == 'SQLSecurityAuditEvents' and (action_name_s in ('RPC COMPLETED','BATCH COMPLETED') or action_name_s contains "DATABASE AUTHENTICATION")
| where LogicalServerName_s == 'xxxx' and database_name_s == 'xxxx'
| where event_time_t > start and event_time_t < end
| where datetime_part("Hour",event_time_t) between (dailystart .. dailyend)
| summarize count() by bin(event_time_t, 1h), application_name_s
| render columnchart with (xtitle = 'Date', ytitle = 'Nb events', title = 'Prod SQL Workload pattern')
And here the new outcome:
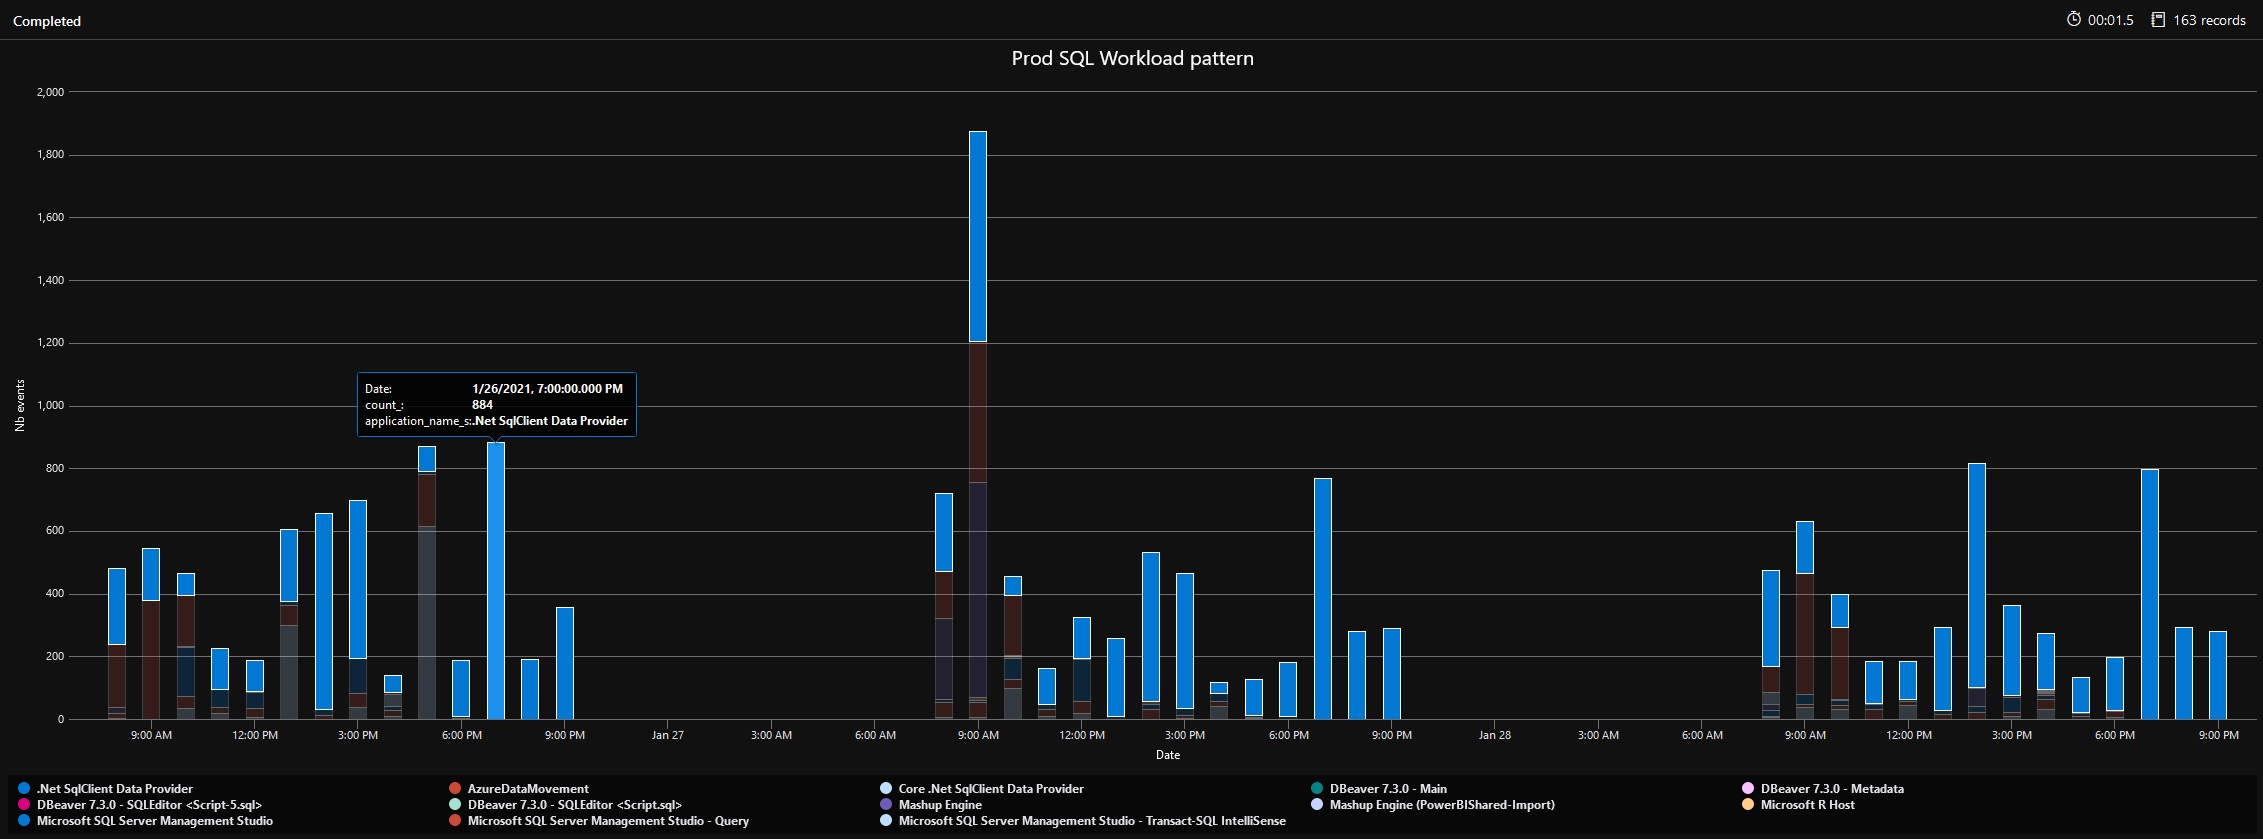
The new chart reveals some activities from SQL Server Management Studio but most part concerns applications with .Net SQL Data Provider. For a better clarity, we need more information related about applications and, in my context, I managed to address the point by reducing the search scope with the service principal name that issued the related audit event. It results to this new outcome that is pretty similar to previous one:
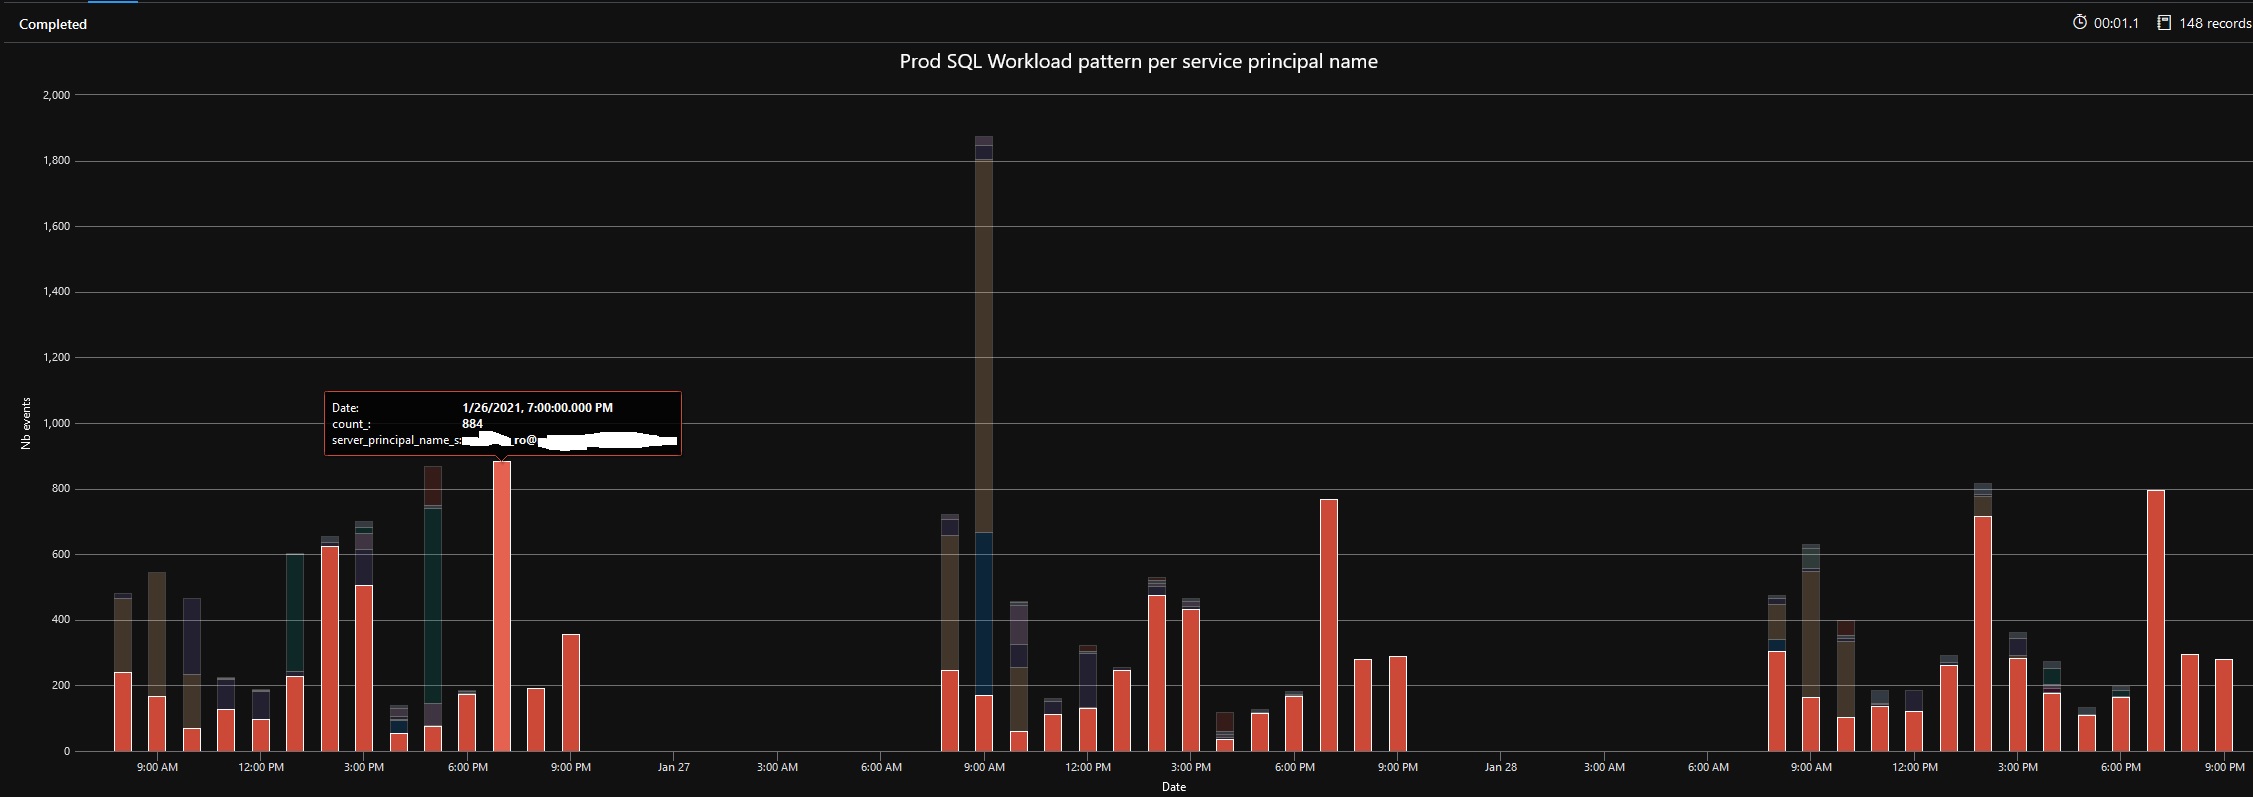
Good job so far. For a sake of clarity, the service principal obfuscated above is used by our Reporting Server infrastructure and reports to get data from this data warehouse. By going this way to investigate daily activity at different moments on the concerned Azure SQL database, we came to the conclusion that using Serverless computer tier didn’t make sense anymore and we need to upgrade likely to another computer tier.
Additional thoughts
Azure monitor is definitely a must to have if you are running resources on Azure and if you don’t own a platform for observability (metrics, logs and traces). Otherwise, it can be even beneficial for freeing up your on-prem monitoring infrastructure resources if scalability is a concern. Furthermore, there is no vendor-locking and you can decide to stream Azure monitor data outside in another place but at the cost of additional network transfer fees according to the target scenario. For example, Azure monitor can be used directly as datasource with Grafana. Azure SQL telemetry can be collected with Telegraf agent whereas audit logs can be recorded in another logging system like Kibana. In this blog post, we just surfaced the Azure monitor capabilities but, as demonstrated above, performing deep analysis correlations from different sources in a very few steps is a good point of this platform.
Ping : 3piebald
Ping : FinOps with Azure Cost management and Azure Log Analytics | David Barbarin