
A couple of months ago I wrote about “Why we moved SQL Server monitoring to Prometheus and Grafana”. I talked about the creation of two dashboards. The first one is blackbox monitoring-oriented and aims to spot in (near) real-time resource pressure / saturation issues with self-explained gauges, numbers and colors indicating healthy (green) or unhealthy resources (orange / red). We also include availability group synchronization health metric in the dashboard. We will focus on it in this write-up.
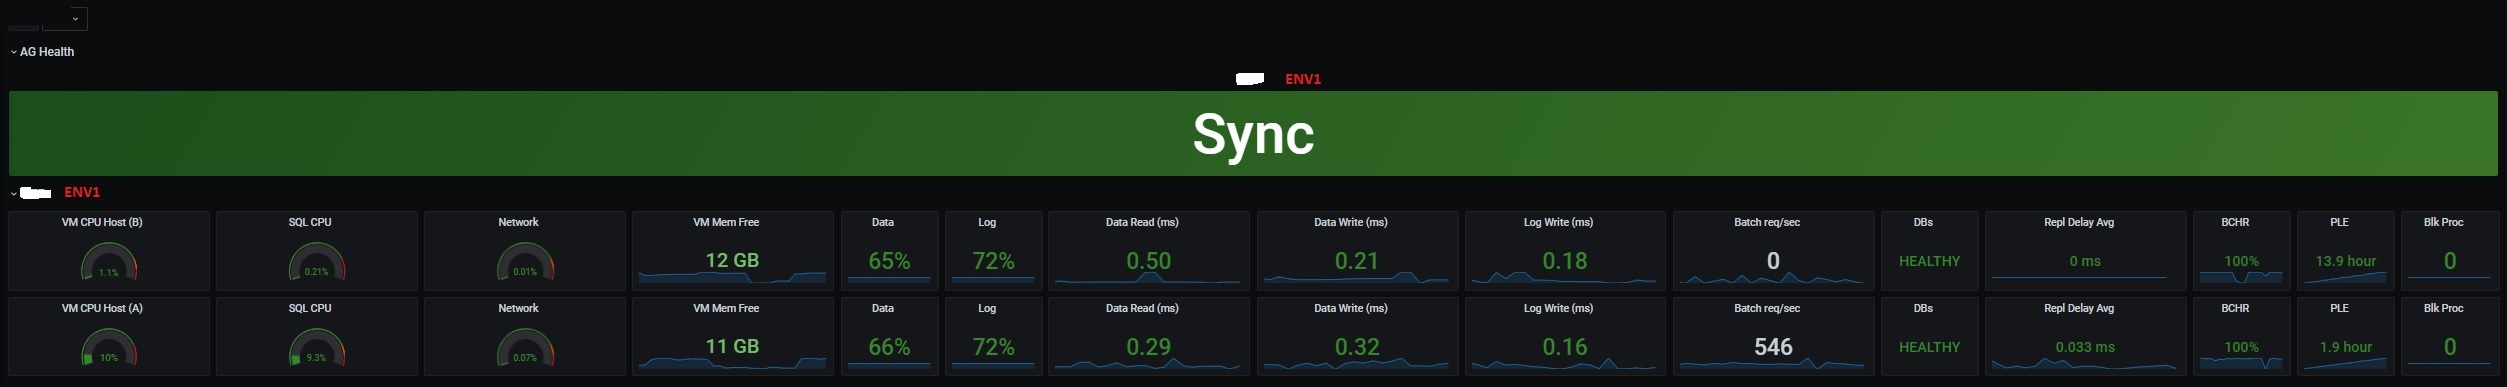
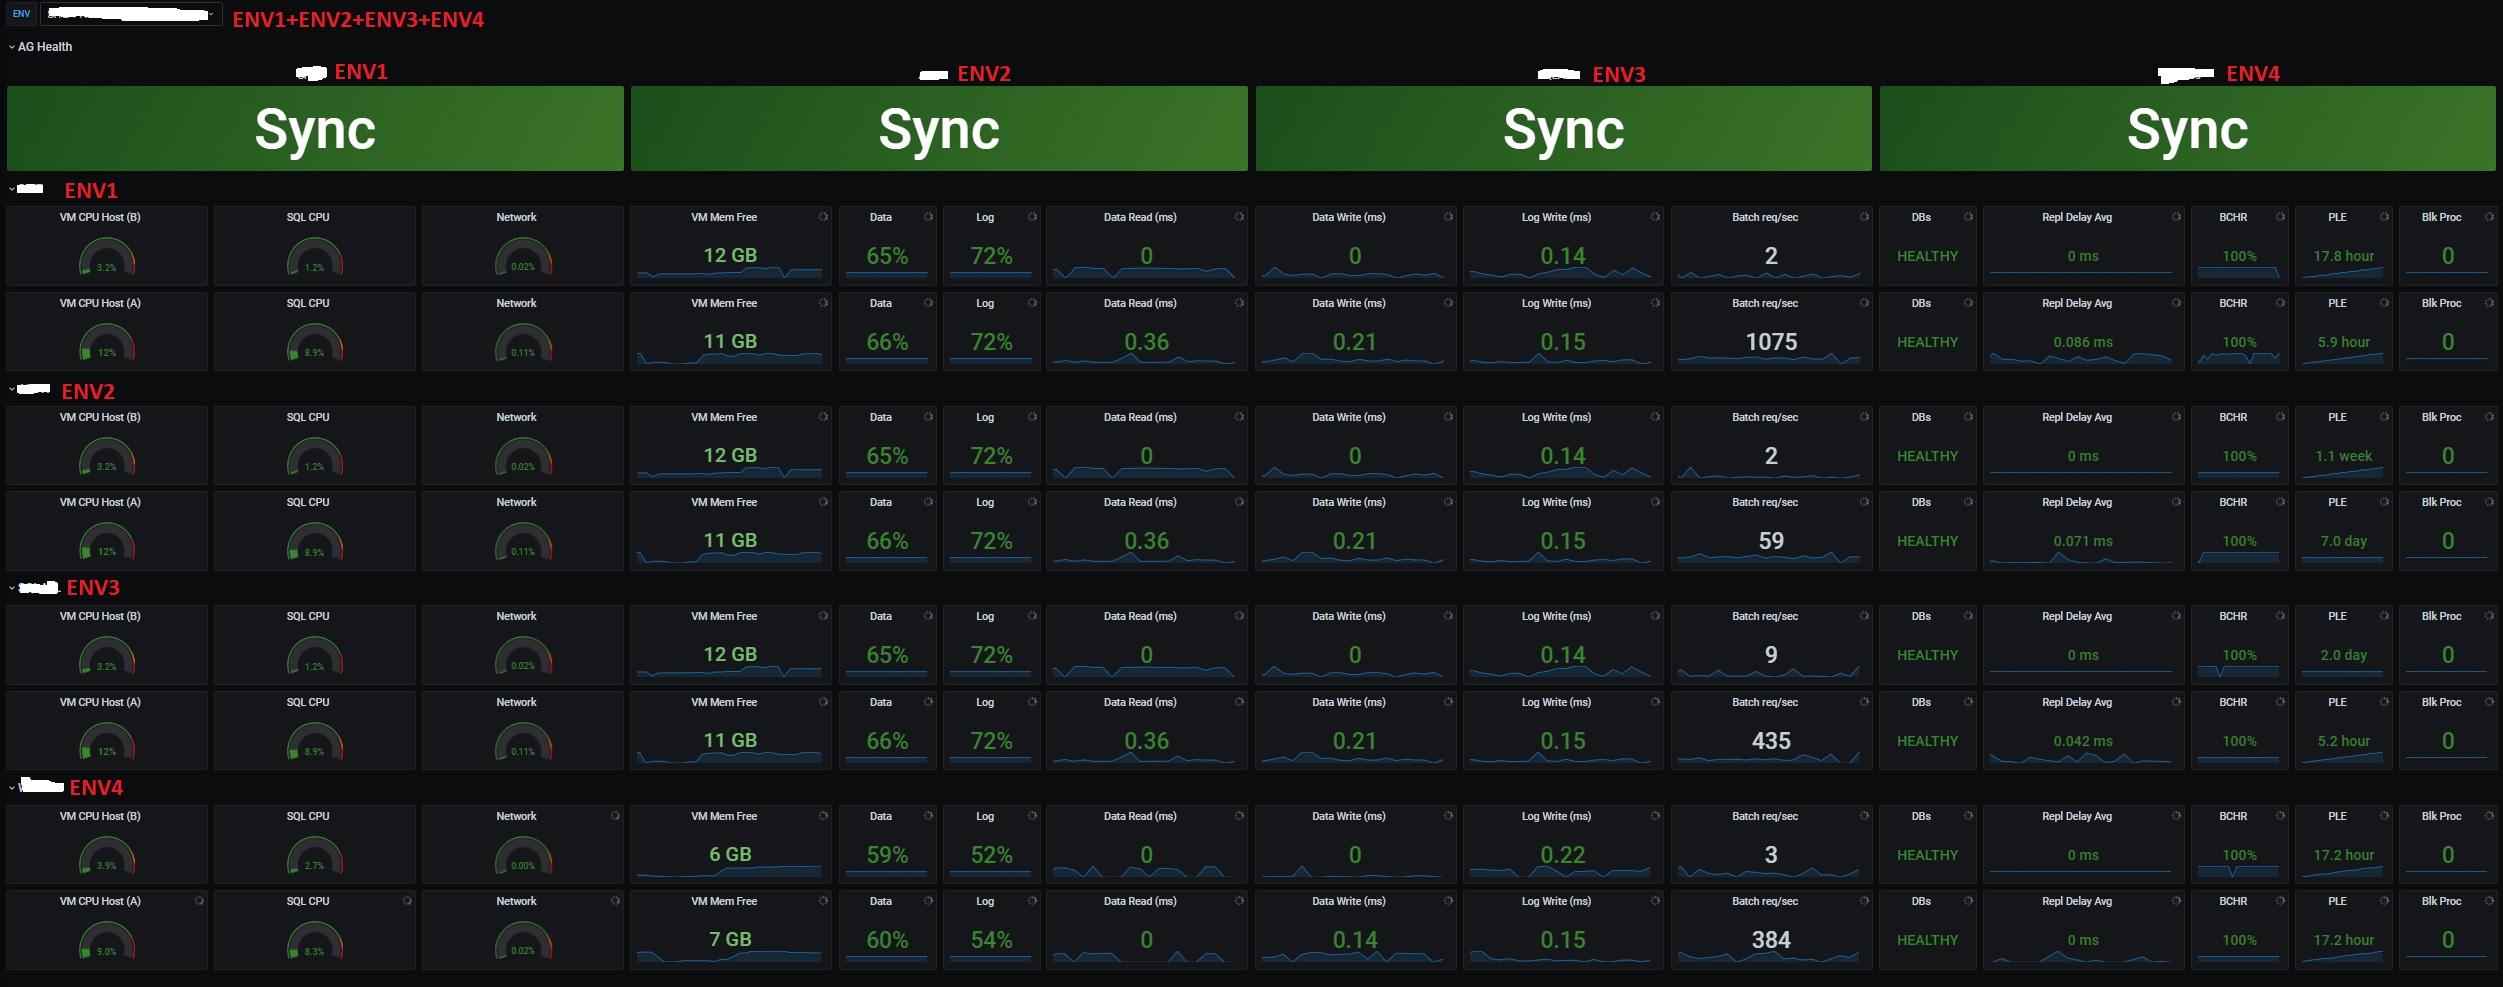
As a reminder, this Grafana dashboard gets information from Prometheus server and metrics related to MSSQL environments. For a sake of clarity, in this dashboard, environment defines one availability group and a set of 2 AG replicas (A or B) in synchronous replication mode. In other words, ENV1 value corresponds to availability group name and to SQL instance names member of the AG group with SERVERA\ENV1 (first replica), SERVERB\ENV1 (second replica).
In the picture above, you can notice 2 sections. One is for availability group and health monitoring and the second includes a set of black box metrics related to saturation and latencies (CPU, RAM, Network, AG replication delay, SQL Buffer Pool, blocked processes …). Good job for one single environment but what if I want to introduce more availability groups and SQL instances in the game?
The first and easiest (or naĂŻve) way we went through when we started writing this dashboard was to copy / paste all the stuff done for one environment the panels as shown below:

After creating a new row (can be associated to section in the present context) at the bottom, all panels were copied from ENV1 to the new fresh section ENV2. New row is created by converting anew panel into row as show below:

Then I need to modify manually ALL the new metrics with the new environment. Let’s illustrate the point with Batch Requests/sec metric as example. The corresponding Prometheus query for the first replica (A) is: (the initial query has been simplified for the purpose of this blog post):
Same query exists for secondary replica (B) but with a different label value:
SERVERA:ENV1 and SERVERB:ENV1 are static values that correspond to the name of each SQL Server instance – respectively SERVERA\ENV1 and SERVERB\ENV1. As you probably already guessed and according to our naming convention, for the new environment and related panels, we obviously changed initial values ENV1 with new one ENV2. But having more environments or providing filtering capabilities to focus only on specific environments make the current process tedious and we need introduce dynamic stuff in the game … Good news, Grafana provides such capabilities with dynamic creation of rows and panels. and rows.
Generating dynamic panels in the same section (row)
Referring to the dashboard, first section concerns availability group health metric. When adding a new environment – meaning a new availability group – we want a new dedicated panel creating automatically in the same section (AG health).
Firstly, we need to add a multi-value variable in the dashboard. Values can be static or dynamic from another query regarding your context. (up to you to choose the right solution according to your context).
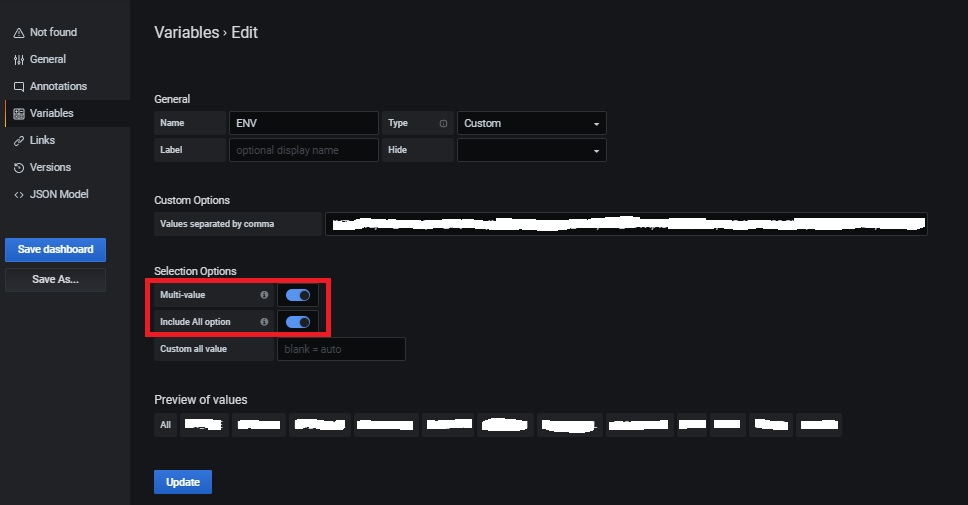
Once created, a drop-down list appears at the upper left in the dashboard and now we can perform multi selections or we can filter to specific ones.

Then we need to make panel in the AG Heath section dynamic as follows:
– Change the title value with corresponding dashboard (optional)
– Configure repeat options values with the variable (mandatory). You can also define max panel per row
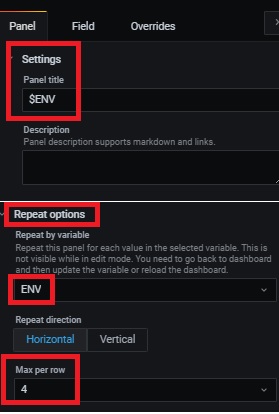
According to this setup, we can display 4 panels (or availability groups) max per row. The 5th will be created and placed to a new line in the same section as shown below:

Finally, we must replace static label values defined in the query by the variable counterpart. For the availability group we are using sqlserver_hadr_replica_states_replica_synchronization_health metric as follows (again, I voluntary put a sample of the entire query for simplicity purpose):
You can notice the regex expression used to get information from SQL Instances either from primary (A) or secondary (B). The most interesting part concerns the environment that is now dynamic with $ENV variable.
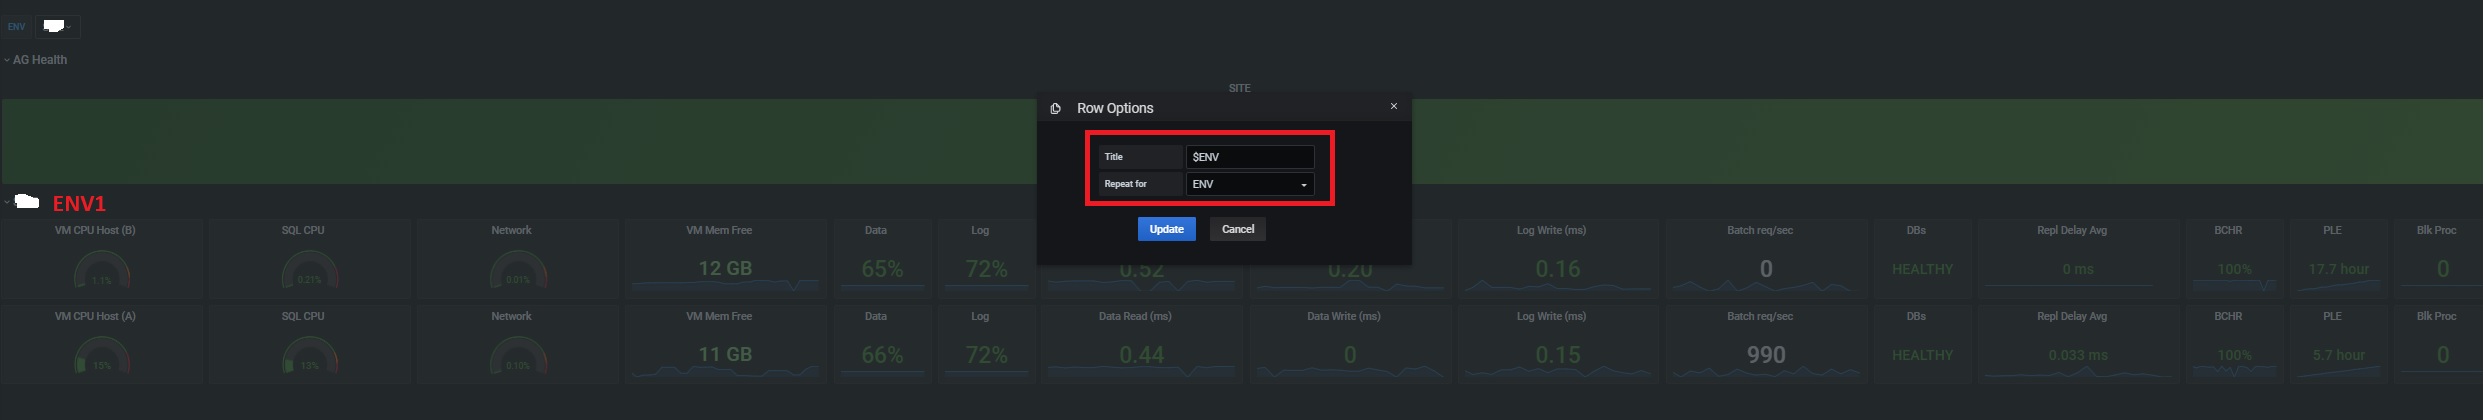
Generating dynamic sections (rows)
As said previously, sections are in fact rows in the Grafana dashboard and rows can contain panels. If we add new environment, we want also to see a new section (and panels) related to it. Configuring dynamic rows is pretty similar to panels. We only need to change the “Repeat for section” with the environment variable as follows (Title remains optional):
As for AG Health panel, we also need to replace static label values in ALL panels with the new environment variable. Thus, referring to the previous Batch Requests / sec example, the updated Prometheus query will be as follows: (respectively for primary and secondary replicas):
…
The dashboard is now ready, and all dynamic kicks in when a new SQL Server instance is added to the list of monitored items. Here an example of outcome in our context:
Happy monitoring!
Ping : 3labourer