
In a previous blog post, I surfaced Azure monitor capabilities for extending observability of Azure SQL databases. We managed to correlate different metrics and SQL logs to identify new execution patterns against our Azure SQL DB, and we finally go through a new compute tier model that fits better with our new context. In this blog post, I would like to share some new experiences about combining Azure cost analysis and Azure log analytics to spot “abnormal” trend and to fix it.
If you deal with Cloud services and infrastructure, FinOps is a discipline you should get into for keeping under control your costs and getting actionable insights that could result in efficient cloud costs. Azure cost management provides visibility and control. Azure cost analysis is my favorite tool when I want to figure out costs of the different services and to visualize improvements after applying quick wins, architecture upgrades on the environment. It is also a good place to identify stale resources to cleanup. I will focus on Azure SQL DB here. From a cost perspective, Azure SQL DB service includes different meter subcategories regarding the options and the service tier you will use. You may have to pay for the compute, the dedicated storage for your database and for your backups (pitr or ltr) and so on … Cost Analysis allows drill-down analysis through different axis with aggregation or forecast capabilities.
In our context, we would like to know if moving from Azure SQL DB Azure Serverless compute tier (Pay-As-You-Go) to Provisioned Tier (+ Azure Hybrid Benefit + Reserved Instances for 3 years) has some good effects on costs. First look at the cost analysis section by applying correct filters and data aggregation on compute tier, confirmed our initial assumption that Serverless didn’t fit anymore with our context now. The chart uses a monthly-based timeframe daily aggregation. We switched to a different model mi-April as show below:
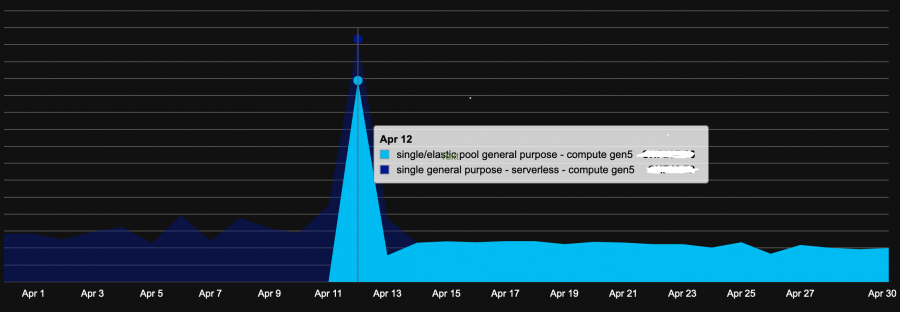
Real numbers are confidential but not so important here. We can easily notice a drop a daily cost (~ 0.5) between Serverless and Provisioned compute tier.
If we get a higher-level view of all services and costs for previous months, the trend is also confirmed for April with serverless + provisioned tier combined costs lower than serverless computer tier only for previous months. But we need to wait for next months to confirm the trend.
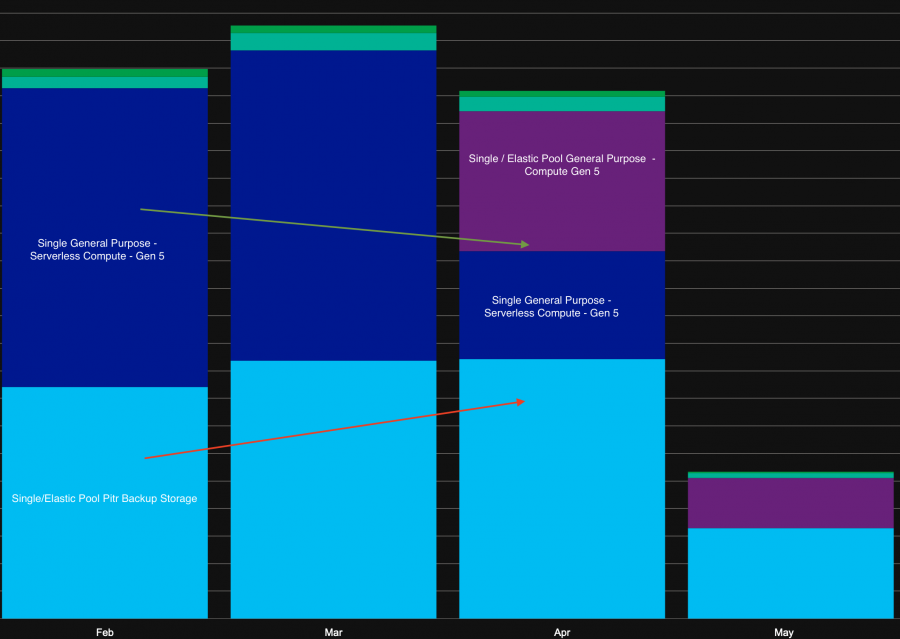
At the same time (and this is the focus on this write-up), we detected a sudden increase of backup storage cost in March that may ruin our optimization efforts made for compute, right? :). To explain this new trend, log analytics came to the rescue. As explained in the previous blog post, we configured streaming of Azure SQL DB telemetry into Log Analytics target to get benefit from solutions like SQL Insights and custom queries from different Azure logs.
Basic metrics are part of Azure SQL DB telemetry and stored in AzureMetrics table. We can use Kusto query to extract backup metrics and get an idea of different backup type trends over the time including FULL, DIFF and LOG backups. The following query shows backup trends within the same timeframe used for billing in cost management (February to May). It also includes a series_file_line function to draw a trendline in the time chart.
| where TimeGenerated >= ago(90d)
| where Resource == 'myDB'
| where MetricName == 'full_backup_size_bytes' // in ('full_backup_size_bytes','diff_backup_size_bytes','log_backup_size_bytes')
| make-series SizeBackupDiffTB=max(Maximum/1024/1024/1024/1024) on TimeGenerated in range(ago(90d),now(), 1d)
| extend (RSquare,Slope,Variance,RVariance,Interception,TrendLine)=series_fit_line(SizeBackupDiffTB)
| render timechart
Full backup time chart
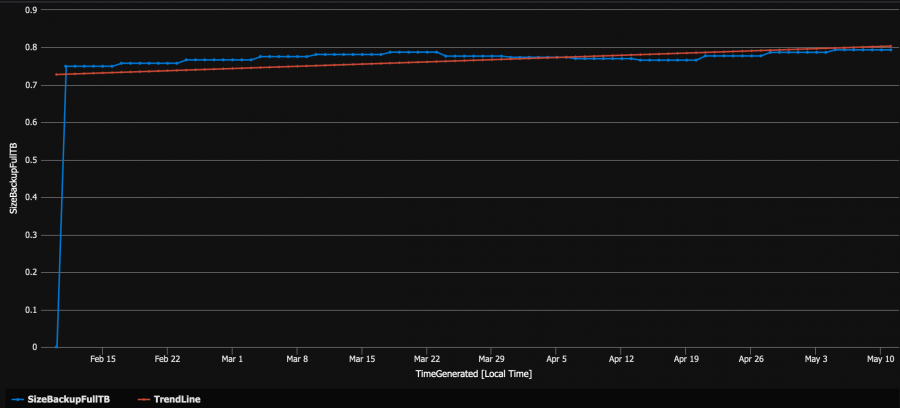
FULL backup size is relatively steady and cannot explain the sudden increase of storage backup cost in our case.
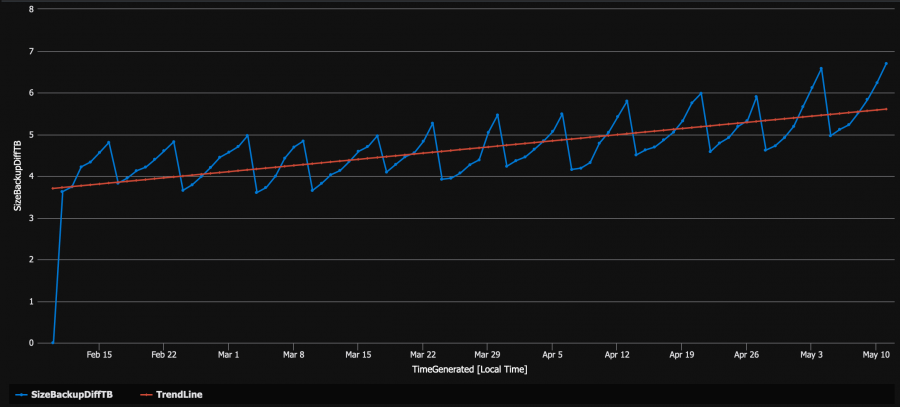
DIFF and LOG backup time chart
…

LOG and DIFF backup charts are more relevant and the trendline suggests a noticeable change starting mi-March. For the first part of the month, the trendline starts misaligning with backup size series.
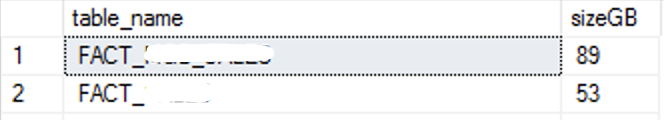
At this stage, we found out the cause of the cost increase, but we were interested in understanding the reasons that may explain such trend. After investigating our ITSM system, we were able to find a correlation with the deployment of new maintenance tool – Ola Hallengren maintenance solution + custom scripts to rebuild columnstore indexes. The latter rebuilds aggressively 2 big fact tables with CCI in our DW (unlike the former tool) that explain the increase of DIFF and LOG backup sizes (~ 1TB).
This is where the collaboration with the data engineering team is starting to find an efficient and durable way to minimize the impact of the maintenance:
– Reviewing the custom script threshold may result to a more relax detection of fragmented columnstore indexes. However, this is only a piece of the solution because when a columnstore index becomes a good candidate for the next maintenance operation, it will lead to a resource-intensive and time-consuming operation (> 2.5h dedicated for these two tables). We are using Azure automation jobs with fair share to execute the maintenance and we are limited to 3h max per job execution. We may use a divide and conquer strategy to fit within the permitted execution timeframe, but it would lead to more complexity and we want to keep maintenance as simple as possible.
– We need to find another way to keep index and stat maintenance jobs execute time under a certain control. Introducing partition for these tables is probably a good catch and another piece of the solution. Indeed, currently concerned tables are not partitioned, and we could get benefit from partition-level maintenance for both indexes and statistics at the partition level.
Bottom line
Azure cost management center and log analytics are a powerful recipe in the FinOps practice. Kusto SQL language is a flexible tool for finding and correlate all kinds of log entries and events assuming you configured telemetry to the right target. I definitely like annotation-like system as we are using with Grafana because it makes correlation with external changes and workflows easier. Next step: investigate annotations on metric charts in Application insights?
See you!!
Ping : 3packaging