
Wait stats are essential performance metrics for diagnosing SQL Server Performance problems. Related metrics can be monitored from different DMVs including sys.dm_os_wait_stats and sys.dm_db_wait_stats (Azure).
As you probably know, there are 2 categories of DMVs in SQL Server: Point in time versus cumulative and DMVs mentioned previously are in the second category. It means data in these DMVs are accumulative and incremented every time wait events occur. Values reset only when SQL Server restarts or when you intentionally run DBCC SQLPERF command. Baselining these metric values require taking snapshots to compare day-to-day activity or maybe simply trends for a given timeline. Paul Randal kindly provided a TSQL script for trend analysis in a specified time range in this blog post. The interesting part of this script is the focus of most relevant wait types and corresponding statistics. This is basically the kind of scripts I used for many years when I performed SQL Server audits at customer shops but today working as database administrator for a company, I can rely on our observability stack that includes Telegraf / Prometheus and Grafana to do the job.
In a previous write-up, I explained the choice of such platform for SQL Server. But transposing the Paul’s script logic to Prometheus and Grafana was not a trivial stuff, but the result was worthy. It was an interesting topic that I want to share with Ops and DBA who wants to baseline SQL Server telemetry on Prometheus and Grafana observability platform.
So, let’s start with metrics provided by Telegraf collector agent and then scraped by Prometheus job:
– sqlserver_waitstats_wait_time_ms
– sqlserver_waitstats_waiting_tasks_count
– sqlserver_waitstats_resource_wait_time_ms
– sqlserver_waitstats_signe_wait_time_ms
In the context of the blog post we will focus only on the first 2 ones of the above list, but the same logic applies for others.
As a reminder, we want to graph most relevant wait types and their average value within a time range specified in a Grafana dashboard. In fact, this is a 2 steps process:
1) Identifying most relevant wait types by computing their ratio with the total amount of wait time within the specific time range.
2) Graphing in Grafana these most relevant wait types with their corresponding average value for every Prometheus step in the time range.
To address the first point, we need to rely on special Prometheus rate() function and group_left modifier.
As per the Prometheus documentation, rate() gives the per second average rate of change over the specified range interval by using the boundary metric points in it. That is exactly what we need to compute the total average of wait time (in ms) per wait type in a specified time range. rate() needs a range vector as input. Let’s illustrate what is a range vector with the following example. For a sake of simplicity, I filtered with sqlserver_waitstats_wait_time_ms metric to one specific SQL Server instance and wait type (PAGEIOLATCH_EX). Range vector is expressed with a range interval at the end of the query as you can see below:
The result is a set of data metrics within the specified range interval as show below:
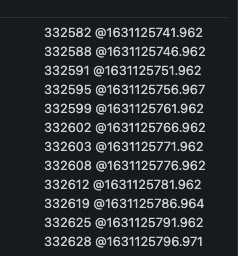
We got for each data metric the value and the corresponding timestamp in epoch format. You can convert this epoch format to user friendly one by using date -r -j for example. Another important point here: The sqlserver_waitstats_wait_time_ms metric is a counter in Prometheus world because value keeps increasing over the time as you can see above (from top to bottom). The same concept exists in SQL Server with cumulative DMV category as explained at the beginning. It explains why we need to use rate() function for drawing the right representation of increase / decrease rate over the time between data metric points. We got 12 data metrics with an interval of 5s between each value. This is because in my context we defined a Prometheus scrape interval of 5s for SQL Server => 60s/5s = 12 data points and 11 steps. The next question is how rate calculates per-second rate of change between data points. Referring to my previous example, I can get the rate value by using the following prompQL query:
… and the corresponding value:

To understand this value, let’s have a good reminder of mathematic lesson at school with slope calculation.
Image from Wikipedia
The basic idea of slope value is to find the rate of change of one variable compared to another. Less the distance between two data points we have, more chance we have to get a precise approximate value of the slope. And this is exactly what it is happening with Prometheus when you zoom in or out by changing the range interval. A good resolution is also determined by the Prometheus scraping interval especially when your metrics are extremely volatile. This is something to keep in mind with Prometheus. We are working with approximation by design. So let’s do some math with a slope calculation of the above range vector:
Slope = DV/DT = (332628-332582)/(@1631125796.971 – @1631125746.962) =~ 0.83
Excellent! This is how rate() works and the beauty of this function is that slope calculation is doing automatically for all the steps within the range interval.
But let’s go back to the initial requirement. We need to calculate per wait type the average value of wait time between the first and last point in the specified range vector. We can now step further by using Prometheus aggregation operator as follows:
Please note we could have written it another way without using the sum by aggregator but it allows naturally to exclude all unwanted labels for the result metric. It will be particularly helpful for the next part. Anyway, Here a sample of the output:
Then we can compute label (wait type) ratio (or percentage). First attempt and naĂŻve approach could be as follows:
But we get empty query result. Bad joke right? We need to understand that.
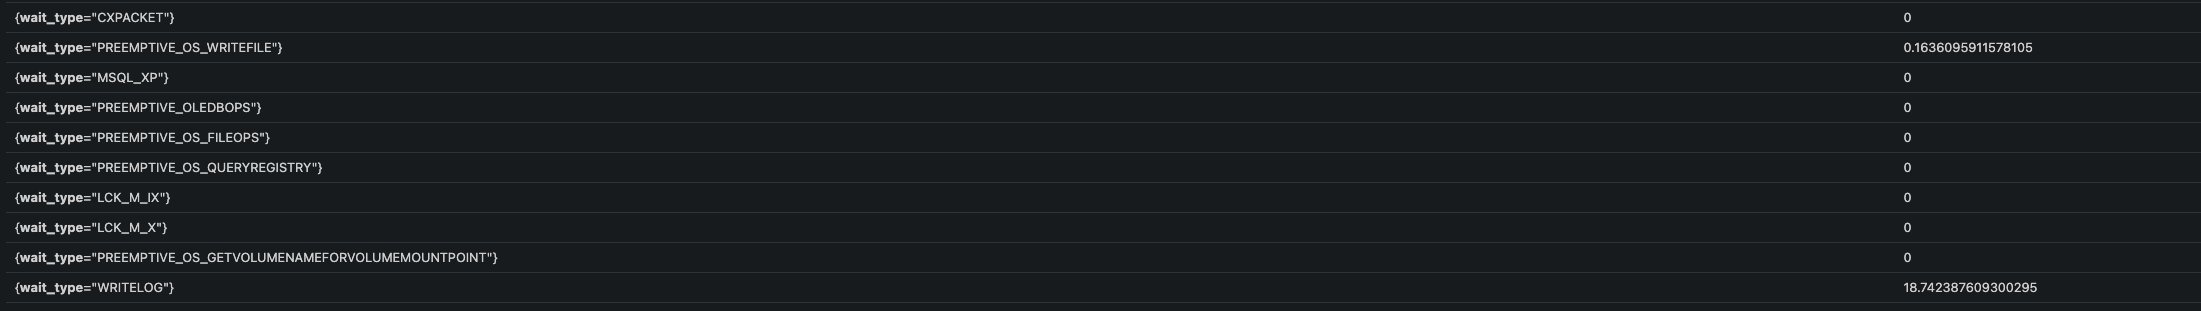
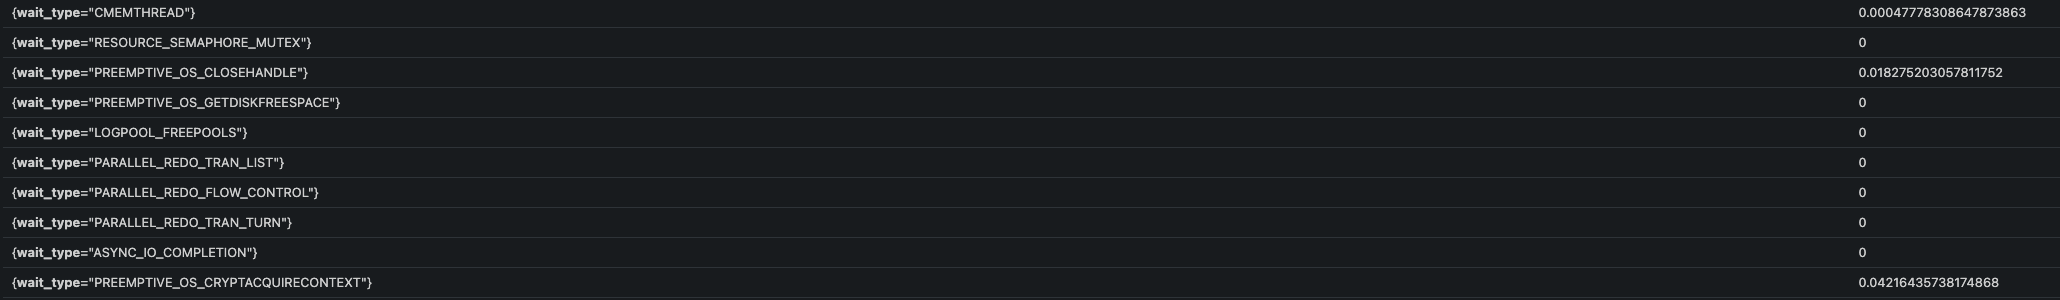
First part of the query gives total amount of wait time per wait type. I put a sample of the results for simplicity:

It results a new set of metrics with only one label for wait_type. Second part gives to total amount of wait time for all wait types as show below:
![]()
With SQL statement, we instinctively select columns that have matching values in concerned tables. Those columns are often concerned by primary or foreign keys. In Prometheus world, vector matching is performing the same way by using all labels at the starting point. But samples are selected or dropped from the result vector based either on « ignoring » and « on » keywords. In my case, they are no matching labels so we must tell Prometheus to ignore the remaining label (wait_type) on the first part of the query:
But another error message …
Error executing query: multiple matches for labels: many-to-one matching must be explicit (group_left/group_right)
In the many-to -one or one-to-many vector matching with Prometheus, samples are selected using keywords like group_left or group_right. In other words, we are telling Prometheus to perform a cross join in this case with this final query before performing division between values:
Here we go!
We finally managed to calculate ratio per wait type with a specified range interval. Last thing is to select most relevant wait types by excluding first irrelevant wait types. Most of wait types come from the exclusion list provided by Paul Randal’s script. We also decided to only focus on max top 5 wait types with ratio > 10% but it is up to you to change these values:
I got 3 relevant wait types with their correspond ratio in the specified time range.
![]()
Pretty cool stuff but we must now to go through the second requirement. We want to graph the average value of the identified wait types within a specified time range in Grafana dashboard. First thing consists in including the above Prometheus query as variable in the Grafana dashboard. Here how I setup my Top5Waits variable in Grafana:
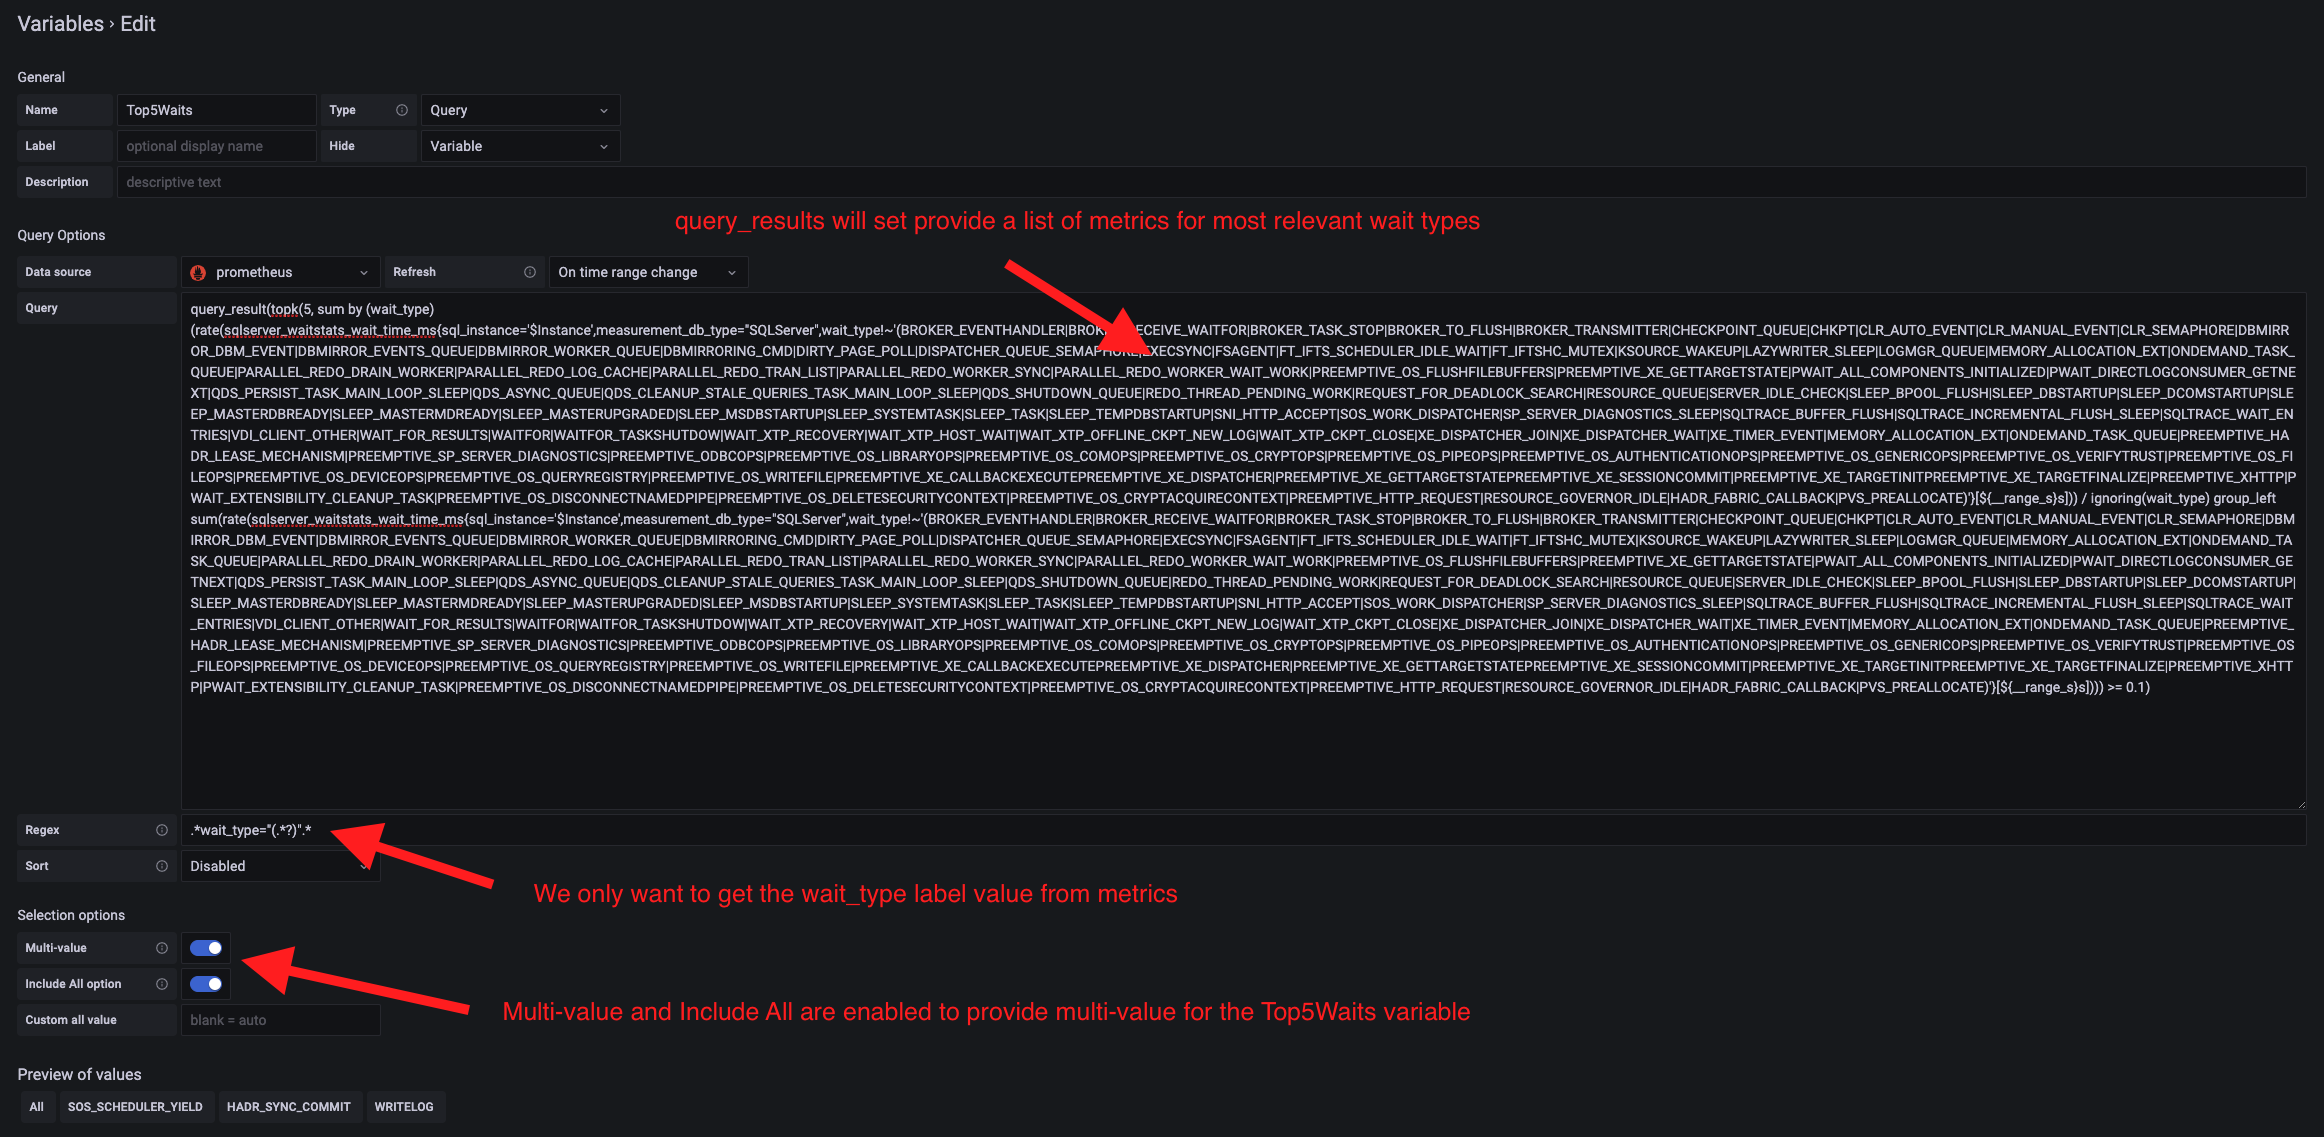
Some interesting points here: variable dependency kicks in with my $Top5Waits variable that depends hierarchically on another $Instance variable in my dashboard (from another Prometheus query). You probably have noticed the use of [${__range_s}s] to determine the range interval but depending on the Grafana $__interval may be a good fit as well.
In turn, $Top5Waits can be used from another query but this time directly in a Grafana dashboard panel with the average value of most relevant wait types as shown below:
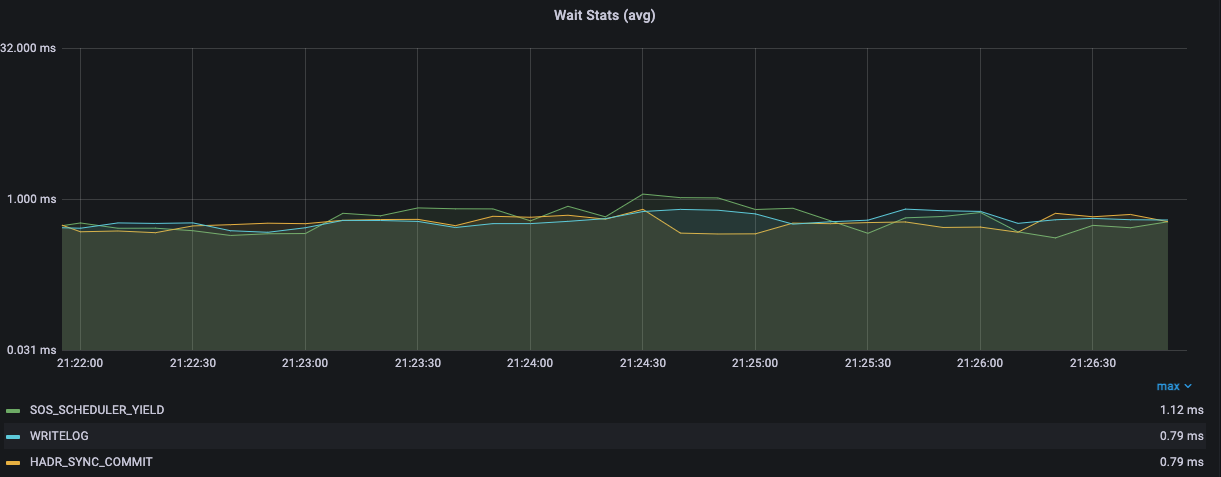
Calculating wait type average is not a hard task by itself. In fact, we can apply the same methods than previously by matching the sqlserver_waitstats_wait_tine_ms and sqlserver_waitstats_waiting_task_count and to divide their corresponding values to obtain the average wait time (in ms) for each step within the time range (remember how the rate () function works). Both metrics own the same set of labels, so we don’t need to use « on » or « ignoring » keywords in this case. But we must introduce the $Top5Waits variable in the label filter in the first metric as follows:
We finally managed to get an interesting dynamic measurement of SQL Server telemetry wait stats. Hope this blog post helps!
Let me know your feedback if your are using SQL Server wait stats in Prometheus and Grafana in a different way !